18 июля 2021
В закладки
Обсудить
Жалоба
Тест на тему «Безработица»
Самостоятельная работа по экономике.
test-bezrabotica.docx
1. Ферма после уборки урожая сократила количество работников. Механизаторы и комбайнеры вновь будут набираться на ферму только весной следующего года. Приведенный пример иллюстрирует безработицу
1) фрикционную
2) сезонную
3) циклическую
4) структурную
2. Гражданка Р., квалифицированный бухгалтер после продолжительного перерыва в работе не может найти работу по специальности. От предложенных ей вакансий секретаря и консьержки она отказалась и ожидает предложений по специальности. Приведенный пример иллюстрирует безработицу
1) фрикционную
2) сезонную
3) циклическую
4) структурную
3. В банковском секторе экономики наступил период роста, возрос спрос на банковские услуги. Какое изменение произойдёт на рынке труда в данной отрасли?
1) начнётся активный набор персонала и открытие новых филиалов
2) снизится активность молодых кадров
3) возрастёт количество сотрудников, переходящих в другие сектора экономики
4) будет отменён социальный пакет для работников
4. Какой из приведённых примеров деятельности фирмы «Крендели и халы» характеризует такой фактор производства, как труд?
1) эксклюзивные рецепты выпечки традиционных хлебобулочных изделий к праздникам
2) договора с сетью кафе домашней кухни на поставку горячей выпечки
3) персонал хлебопёков и кондитеров, имеющий международные сертификаты
4) арендуемые фирмой помещения, в которых располагаются пекарни
5. К негативным последствиям безработицы относится
1) стремление работников к повышению своей квалификации
2) создание и деятельность государственных служб занятости
3) утрата частью трудоспособного населения трудовых навыков и стимулов к труду
4) расширение возможностей для женщин заниматься домашним хозяйством и воспитанием детей
6. Повышение востребованности специалистов в области юридических наук иллюстрирует ситуацию на рынке
1) труда 3) средств производства
2) инноваций 4) капиталов
7. Рост популярности кафе с разнообразным ассортиментом чая, кофе и сладостей резко повысил потребность в таких специалистах, как кондитеры, бармены и официанты. Какое свойство рынка труда проявилось в данном факте?
1) связь спроса на труд со спросом на услуги
2) установление определённого уровня безработицы
3) государственное регулирование занятости
4) высокая конкуренция работников
8. Экономический кризис привёл к закрытию предприятий и росту безработицы во многих отраслях. Какой вид безработицы иллюстрируется этим примером?
1) структурная
2) фрикционная
3) циклическая
4) сезонная
9. Человек, который болен бронхитом, оформил больничный лист и в период его действия временно не работает, относится к категории
1) безработных
2) временно безработных
3) не включаемых в общую численность рабочей силы
4) занятых
10. Если численность безработных в стране равна 5 млн человек, численность занятых — 45 млн человек, то уровень безработицы равен
1) 10%
2) 11%
3) 15%
4) 20%
Ответы
1) 2
2) 1
3) 1
4) 3
5) 3
6) 1
7) 1
 3
3
9) 4
10) u= (5 / (45+5))*100% = 10%
Экономическая теория — тесты МУ им. Витте (МИЭМП) без ответов
1. Установите соответствие между фундаментальными экономическими категориями и их определениями:
- созданные человеком ресурсы, которые используются для производства товаров и услуг
- природные ресурсы
- нужда в чем-либо необходимом для поддержания жизнедеятельности, развития личности и общества
- основные экономические вопросы
- товары и услуги, удовлетворяющие потребности людей
2. В фундаментальную проблему экономической теории входят следующие положения:
- равное распределение ресурсов
- редкость (ограниченность) ресурсов
- безграничные потребности
- неограниченные производственные ресурсы
- максимальное удовлетворение потребностей
3. Установите соответствие между факторами производства и формами доходов:
- труд
- земля
- предпринимательская способность
- капитал
4. К первичным потребностям относятся потребности:
- в питье
- в развлечении
- в еде
- в одежде
- в образовании
5. Установите соответствие между типами экономических систем и господствующими формами собственности:
- рыночная система
- командная система
- смешанная система
- традиционная система
6. Расположите в исторической последовательности их возникновения следующие экономические школы:
- неоклассическое направление
- меркантилизм
- кейнсианство
- маржинализм
- классическая школа
7. Когда экономические проблемы решаются частично рынком, частично государством, то экономика:
- смешанная
- рыночная
- традиционная
- командная
8. Какие из нижеперечисленных благ являются экономическими благами?
- газированная вода
- пищевой лед, используемый в барах
- вода из родника недалеко от вашего дома
- бутилированная вода
9. Проблемы, что, как и для кого производить имеют отношение:
- только к слаборазвитым странам
- только к рыночной экономике
- только к обществам с централизованным планированием
- к любому обществу
10. Основная проблема экономической теории и практики состоит в разрешении противоречия между растущими потребностями людей и ограниченностью находящихся в распоряжении ресурсов. Совокупность ресурсов при их полном и эффективном использовании на основе данной технологии определяет производственные возможности страны и их границы. Возможный и желательный выпуск продукции характеризует кривая производственных возможностей. Множественность потребностей при ограниченности ресурсов ставит проблему экономического выбора наилучшего варианта их использования, определение приоритетов, очередности удовлетворения выбранных потребностей.
Фундаментальные экономические вопросы «что, как и для кого производить» решаются на микро- и макроуровне. Какой из этих вопросов может решаться только на макроэкономическом уровне? …
Проблемы, что, как и для кого производить имеют отношение: …
Закон убывающей производительности действует, если: …
Блага, находящиеся в неограниченном количестве, называются: …
В экономике действует закон убывающей производительности факторов производства. Каким образом в этих условиях поддерживается экономический рост? …
11. Если какое – либо имущество взять в аренду, то арендатор:
- является полным собственником
- распоряжается ценностью данного имущества (может продать его или подарить)
- получает доход, используя это имущество
- распоряжается потребительной стоимостью имущества
12. Установите последовательность развития общественного хозяйства:
- капиталистическое товарное хозяйство
- транснациональные корпорации
- простое товарное хозяйство
- натуральное хозяйство
13. Какую функцию не выполняет рынок?
- ценообразующую
- информационную
- регулирующую
- посредническую
- методологическую
14. … был исторически первой школой в экономической теории.
15. Фундаментальная проблема, с которой сталкиваются все экономические системы:
- потребление
- ограниченность ресурсов
- инвестиции
- производство
16. Нужда в чем-либо необходимом для поддержания жизнедеятельности, развития личности и общества – это …
17. Рыночная экономика определяется:
- всеобщностью и универсальностью товарных отношений
- экономической направленностью, регулируемой полной волей государства
- замкнутостью, ограниченностью рамками хозяйства
- наличием хозяйств, основанных на коллективной форме собственности
18. Существование государственной собственности обусловлено:
- стремлением увеличить государственные доходы
- необходимостью решения общенациональных и социальных задач
- необходимостью поддержания уровня жизни населения
- наличием капиталоёмких и нерентабельных отраслей
19. Экономика, в которой экономические проблемы решаются частично рынком, частично правительством, называется …
20. Рыночная экономика возникла на определенной стадии развития товарного производства. Рынок представляет собой тип хозяйственных связей между субъектами экономики, основанный на конкурентных началах, при котором обеспечивается взаимодействие производства и потребления без посреднических институтов, регулирующих деятельность производителей и потребителей.
Условия возникновения товарного хозяйства: …
Товар, служащий всеобщим эквивалентом – это…: …
Рынок не выполняет функцию: …
Автором принципа “невидимой руки рынка” является: …
Субъект рыночного хозяйства: …
21. Рынок цемента характеризуется следующими функциями спроса и предложения: Qd = 12-P; Qs = -3+2P. Определить равновесную цену и равновесный объем продаж данного товара.
- р=5; Q=7
- р=3; Q=9
- р=6; Q=3
- р=12; Q=1
22. Рынок некоторого товара представлен следующими функциями спроса и предложения: Qd = 600-35p; Qs = 100+100p, где Qd – величина спроса, Qs – величина предложения, р – рыночная цена. Определить равновесный объем продаж данного товара.
- 600
- 555
- 458,95
- 470,5
23. Если реальный доход потребителя возрастет, линия бюджетных ограничений
- изменится наклон бюджетной линии
- станет вертикальной
- сместится вправо
- сместится влево
24. Установите последовательность развития общественного хозяйства:
- натуральное хозяйство
- капиталистическое товарное хозяйство
- транснациональные корпорации
- простое товарное хозяйство
25. Кривая безразличия показывает:
- эластичность спроса на товары, имеющие одинаковую полезность
- различные комбинации двух экономических благ, имеющих одинаковую полезность
- убывающую предельную полезность
- динамику спроса на товары, имеющие одинаковую полезность
26. Смещение кривой предложения вправо может произойти в результате:
- увеличения налогов
- увеличения субсидий
- инфляционных ожиданий
- снижения цен на ресурсы, используемые для производства данного товара
- внедрения новых технологий, повышающих производительность труда
27. Изменение величины предложения на изменение цены на 1% называется …
28. Установите соответствия между категориями рыночной экономики и их определениями:
- институт, закрепляющий экономическую обособленность людей
- распределение основных факторов производства на базе сигнальной системы цен
- ликвидное средство обмена
- обособление различных видов хозяйственной деятельности людей
- отношения между людьми по поводу присвоения имущества
29. Величина спроса на товары не зависит от:
- доходов покупателей
- рекламы
- субсидий производителям
- моды
30. Установите соответствие между видами эластичности спроса и динамикой спроса:
- изменение цены на 1% вызывает изменение спроса на 1%
- изменение цены на 1% вызывает изменение спроса более, чем на 1%
- изменение цены на 1% вызывает изменение спроса менее, чем на 1%
- спрос никак не реагирует на изменение цены
- бесконечно малое изменение цены вызывает максимальное изменение спроса
31. Абсолютно неэластичный спрос – это когда:
- при изменении цены на товар спрос остается постоянным
- повышение цены приводит к росту спроса
- коэффициент эластичности спроса равен нулю
- увеличение предложения не приводит к росту спроса
32. При росте налогов наблюдается:
- увеличение спроса на товар
- стабильность предложения товара
- сокращение предложения товара
- увеличение предложения товара
33. Закон предложения отражает … связь между ценой и величиной спроса.
34. Товар, служащий всеобщим эквивалентом, это …
35. Какие из следующих утверждений относятся к характеристике неэластичного спроса на товар?
- покупатели расходуют на его покупку незначительную долю своего дохода
- период времени, в течение которого предъявляется спрос, является очень коротким
- данный товар является для потребителей товаром первой необходимости
- имеется большое число товаров-заменителей
- относительное изменение объема спроса меньше, чем относительное изменение цены
36. Какую связь отражает закон спроса между величиной спроса и ценой?
- обратную
- несущественную
- временную
- прямую
37. Установите последовательность стадий формирования нового рыночного равновесия:
- увеличение рыночной цены
- снижение цены предложения
- увеличение величины предложения и сокращение величины спроса
- снижение рыночной цены
- увеличение спроса и сокращение предложения в отрасли
38. Субъекты рыночного хозяйства:
- домохозяйства
- отрасль
- цех
- бизнес
- государство
- трудовой коллектив
39. Установите соответствие между взаимодополняющими товарами:
- простой карандаш
- автомобиль
- мангал
- холодильник
- обувь
40. Для максимизации полезности благ потребитель должен так истратить расходуемую сумму денежных средств, чтобы:
- общая полезность в расчете на единицу товара была одинаковой
- предельная полезность каждого товара, полученная в расчете на 1 рубль, была одинаковой
- общая полезность каждого товара, полученная в расчете на 1 рубль, была одинаковой
- предельная полезность каждого потребленного товара была одинаковой
41. Издержки упущенных возможностей – это:
- отчисления на социальные нужды
- бухгалтерские издержки
- проценты за кредит
- альтернативные издержки
42. Экономические издержки:
- включают альтернативные издержки
- превышают явные и неявные издержки на величину нормальной прибыли
- включают в себя явные и неявные издержки
- включают в себя явные, но не включают неявные
- равны нормальной прибыли
43. Рынок, где единственный покупатель противостоит множеству продавцов, называется …
Найдите соответствующее определение перечисленным понятиям теории фирмы:
- соотношение между приростом используемых ресурсов и приростом объема выпуска продукции
- период, в течение которого не изменяется объем применения некоторых факторов производства
- выпуск продукции, получаемый при использовании всего объема применяемых факторов производства
- объем продукции в расчете на единицу используемого труда
- период, в течение которого изменяется объем применения всех факторов производства
44. Рынки совершенной и монополистической конкуренции имеют общую черту:
- выпускаются однородные товары
- каждая фирма сталкивается с горизонтальной кривой спроса на свой продукт
- выпускаются дифференцированные товары
- на рынке оперирует множество покупателей и продавцов
45. Установите соответствия между видами издержек производства и их определениями:
- дополнительные издержки, связанные с увеличением производства единицы продукции
- общие издержки в расчете на единицу продукции
- издержки, величина которых не зависит от объема выпускаемой продукции
- альтернативные издержки использования ресурсов, принадлежащих владельцам фирмы
- переменные издержки в расчете на единицу продукции
46. Отрасль, в которой деятельность единственной фирмы более эффективна – это …
47. Реальная заработная плата – это:
- количество товаров и услуг, которые можно приобрести на заработную плату
- сумма денег, которую рабочий получает на руки
- стоимость потребительской корзины
- прожиточный минимум
48. В краткосрочном периоде фирма производит 500 единиц продукции. Средние переменные издержки составляют 2 долл., средние постоянные издержки -0,5 долл. Общие издержки составят:
Соответствие между рыночными структурами несовершенной конкуренции и количеством фирм в отрасли:
- олигополия
- дуополия
- монополистическая конкуренция
- чистая монополия
49. Основным признаком монополистической конкуренции является:
- дифференциация продукта
- ограниченное число покупателей
- ограниченное число продавцов
- один покупатель
50. Расположите рынки в порядке уменьшения свободы входа и выхода:
- рынок совершенной конкуренции
- олигополия
- рынок монополистической конкуренции
- рынок чистой монополии
- дуополия
51. К переменным издержкам (ТVC) могут быть отнесены:
- затраты на сырье и материалы
- расходы на электроэнергию
- обязательные страховые платежи
- заработная плата рабочих
- затраты на приобретение производственных площадей и оборудования
52. К постоянным издержкам (ТFC) могут быть отнесены:
- проценты на банковский кредит
- служебный оклад директора завода
- налог на недвижимость
- арендная плата
- заработная плата, стоимость сырья и материалов
53. Доход, порождаемый ссудным капиталом называется …
54. Установите последовательность в уменьшении возможности применения ценовой конкуренции:
- монополия
- картель
- рынок совершенной конкуренции
- олигополия
- рынок монополистической конкуренции
55. Земельная рента будет расти при прочих равных условиях, если:
- снижается цена земли
- растет спрос на землю
- сокращается спрос на землю
- предложение земли растет
- Очистить мой выбор
56. Олигополия – это рыночная структура:
- вход в отрасль ограничен высокими барьерами
- с государственным регулированием цен
- в которой каждая фирма ведет собственную ценовую политику
- при которой доминирует небольшое количество продавцов
- с множеством фирм, вход на рынок свободен
57. В краткосрочном периоде фирма, стремящаяся увеличить прибыль, расширит производство, если при этом:
- предпринимательская прибыль равна нулю
- рыночная цена выше общих издержек
- рыночная цена выше переменных издержек
- рыночная цена на изделие фирмы ниже постоянных издержек
58. Условное малое предприятие, выпустив 50 изделий, имело следующие издержки: постоянные – 200 ден. ед., средние валовые – 60 ден. ед. Его средние переменные издержки составили: …
59. Какие из перечисленных ниже услуг, производимых домашними хозяйствами, должны быть учтены при вычислении ВВП:
- услуги по покупке продуктов питания членами домашнего хозяйства для собственного потребления
- уборка квартиры наемной прислугой
- ремонт телевизора в мастерской
- уборка квартиры одним из членов семьи
- перевозка главой семейства на собственном автомобиле членов семьи
- ремонт личного автомобиля членом семьи
60. Какие эффекты влияют на кривую совокупного спроса:
- процентной ставки
- мультипликатора
- реального богатства
- акселератора
- импортных закупок
61. Установите последовательность в порядке расчета этих взаимосвязанных показателей Системы национальных счетов:
- ВНП
- ЧНП
- ВВП
- личный доход
- национальный доход
62. Интенсивный экономический рост достигается:
- благодаря поддержке государства
- за счет количественного увеличения используемых факторов производства
- за счет иностранных инвестиций
- за счет качественного усовершенствования факторов производства
- благодаря научным открытиям
63. В период экономического спада менее всего сокращаются:
- уровень цен
- величина предпринимательской прибыли
- уровень заработной платы
- расходы потребителей на покупку лекарств
- трансферты
64. В текущем году закрылся завод по производству телевизоров.
На каком показателе СНС отразится это событие? …
Как это событие отразится на ВВП страны и почему? …
Как это изменение будет зарегистрировано, если ВВП вычисляется методом добавленной стоимости? …
Как это изменение будет зарегистрировано, если ВВП вычисляется методом по расходам? …
Как это изменение будет зарегистрировано, если ВВП вычисляется методом факторных доходов? …
Доход, получаемый собственниками земли и недвижимого имущества, называется …
65. Общая рыночная стоимость всех конечных товаров и услуг, произведенных национальными производителями, независимо от их местонахождения (внутри страны или за рубежом) – это …
66. Установите соответствия между циклами и их продолжительностью:
- Циклы Жугляра
- Циклы Кондратьева
- Циклы Китчина
- Циклы Кузнеца
67. Уровень ВВП, соответствующий полной занятости ресурсов, называется … ВВП.
68. Уровень ВВП, соответствующий полной занятости ресурсов, называется … ВВП:
- потенциальным
- фактическим
- номинальным
- реальным
69. Установите соответствие между экономическими явлениями и соответствующей фазой среднесрочного цикла:
- приостановление падения цен, стабилизация товарных запасов
- повышение цен и сокращение безработицы
- стремительное падение цен
- повышение уровня производства
70. В период подъема не наблюдается:
- сокращение затрат потребителей на покупку товаров длительного пользования
- рост занятости
- рост цен
- сокращение уровня занятости
- падение уровня прибыли
71. Определите, учитываются ли в ВВП (по расходам) нижеприведенные расходы и, если учитываются, то чей это расход.
Семья заплатила за дом, построенный 3 года назад: …
Компания увеличила запасы муки и зерна на 50 тыс. р.: …
Государство выплатило пенсионеру 17 тыс. руб. пенсии: …
Студент платит за обучение в университете 100 тыс. руб. в год: …
Иванов И. И. купил новую машину, сделанную в Японии: …
72. Национальный доход – это:
- ВНП – амортизационные отчисления
- ЧНП – доход после уплаты налогов
- ВНП – ЧНП
- ЧНП – косвенные налоги на бизнес
73. Установите последовательность в увеличении продолжительности экономических циклов
- Циклы Китчина
- Циклы Кондратьева
- Циклы Кузнеца
- Циклы Жугляра
74. Факторами экономического роста являются:
- природные ресурсы
- трудовые ресурсы
- основные фонды
- НТП
- денежные агрегаты
75. К методам подсчета ВВП относятся методы:
- мультипликационного эффекта
- по расходам
- акселератора
- суммирования добавленных стоимостей
- по доходам
76. Определите последовательность фаз внутри каждого экономического цикла:
- «подъем»
- «кризис»
- «оживление»
- «депрессия»
77. Если Центральный банк снижает учетную ставку процента, то это:
- сокращает денежную массу в обращении
- стимулирует сбережения
- сдерживает спрос на ссудный капитал
- приводит к оживлению конъюнктуры
78. Установите соответствия между видами налогов и их ставками:
- НДФЛ
- налог на имущество юридических лиц в Москве
- НДС
- налог на прибыль юридических лиц
- отчисления в Пенсионный Фонд
79. По какому из перечисленных налогов «налоговое бремя» может быть переложено с плательщика налога по закону на носителя налога:
- акциз
- личный подоходный налог
- налог на прибыль юридических лиц
- налог на недвижимость
80. Установите последовательность в увеличении ставок взимаемых в РФ налогов и платежей:
- подоходный налог с физических лиц
- отчисления в Фонд обязательного медицинского страхования
- отчисления в Фонд обязательного социального страхования
- налог на прибыль
- налог на добавленную стоимость
81. В стране существует высокая инфляция, правительство и Центральный банк проводят политику ее сдерживания. Установите соответствие инструментов и видов регулирующей политики государства:
- продажа государственных облигаций
- повышение налоговых ставок
- повышение нормы обязательных резервов
- сокращение государственных расходов
82. Доход по акциям называется …
83. Превышение доходов госбюджета над его расходами называется …
84. К косвенным налогам относятся:
- акциз
- личный подоходный налог
- налог на наследство
- таможенные пошлины
- налог на прибыль юридических лиц
85. Прямое влияние на увеличение количества денег в обращении оказывает:
- снижение количества выпускаемых товаров
- увеличение безналичных расчетов
- увеличение скорости оборота денег
- рост цен выпускаемых товаров
86. Определите последовательность процессов, характеризующих «эффект вытеснения»:
- снижение частных инвестиций в экономике
- сокращение предложения на рынке ссудных капиталов
- выпуск ценных бумаг правительством для погашения дефицита бюджета
- повышение ставки процента
87. К безналичным деньгам можно отнести:
- вексель
- чек
- кредитную карту
- облигацию
- счет в коммерческом банке
88. В систему специализированных кредитно-финансовых учреждений включаются:
- пенсионные фонды
- сберегательные кассы
- коммерческие банки
- страховые компании
- инвестиционные фонды
89. Рынок невозможен без денег, денежного обращения. Деньги в экономике рассматриваются как наиболее ликвидный активный капитал. В зависимости от вида обращаемых денег выделяется два основных типа систем денежного обращения: система обращения металлических денег, и система обращения кредитных или бумажных денег.
Абсолютной ликвидностью обладают: …
Отличие бумажных денег от кредитных денег заключается в том, что они: …
«Квази-деньги» включают в себя: …
Скорость оборота денег – это: …
Банковский чек обеспечен: …
90. Установите последовательность в увеличении ликвидности следующих активов:
- земля
- производственное здание
- золото
- акция Сбербанка
- 10 рублевая банкнота
91. Если Центральный банк повышает учетную ставку, то эта мера направлена в первую очередь:
- на стимулирование роста величины сбережений населения
- на содействие росту объемов ссуд, предоставляемых ЦБ коммерческим банкам
- на снижение общей величины резервов коммерческих банков
- на увеличение общего объема резервов коммерческих банков
92. Функциями денег являются:
- средство производства
- средство платежа
- мера стоимости
- средство обращения
- средство накопления
93. Денежно-кредитная политика представляет собой часть государственной экономической политики, направленной на повышение благосостояния российских граждан. Банк России реализует денежно-кредитную политику в рамках режима таргетирования инфляции, и его приоритетом является обеспечение ценовой стабильности, то есть достижение стабильно низкой инфляции. С учетом структурных особенностей российской экономики установлена цель по снижению инфляции до 4% в 2017 году и сохранению ее вблизи данного уровня в среднесрочной перспективе. Денежно-кредитная политика воздействует на экономику через процентные ставки, основным ее параметром является ключевая ставка Банка России.
Денежно-кредитная политика проводится: …
Центральный банк проводит политику «дешевых денег» для: …
Если в экономике страны усиливается депрессия и растет безработица, то при проведении кредитно-денежной (монетарной) политики Центральный банк будет: …
Для сдерживания инфляции инструментами кредитно-денежной (монетарной) политики Центральный банк страны будет: …
Если в экономике страны возникли кризисные явления, то для их преодоления Центральный банк, используя инструменты кредитно-денежной (монетарной) политики, должен: …
94. К функциям Центрального банка страны относятся:
расчетно-кассовое обслуживание организаций
обеспечение необходимой степени ликвидности банковской системы
установление ставки рефинансирования
установление минимальных норм обязательных резервов
расчетные операции по счетам правительства
95. Кредитными деньгами являются:
- карта Visa
- банкнота
- акция
- чек
96. Экономически активное население страны составило 84889 тыс. человек, а занятых было 80796 тыс. чел. Определите уровень безработицы. …
97. … инфляция сопровождается всеобщим государственным контролем над ценами.
98. Безработица, вызванная падением совокупного спроса и спадом производства, называется …
99. Расположите формы безработицы в порядке увеличении среднего срока их продолжительности:
- застойная
- фрикционная
- циклическая
- сезонная
- структурная
100. В результате непредвиденной инфляции:
- лица с фиксированным доходом богатеют за счет лиц с переменным доходом
- кредиторы богатеют за счет заемщиков:
- заемщики богатеют за счет кредиторов
- происходит перераспределение дохода от капитала к наемным работникам
101. Установите последовательность в сокращении доли групп, имеющих определенный статус в сфере занятости, относительно общей численности населения страны:
- занятые
- безработные
- экономически активное население
- трудоспособное население
- экономически неактивное население
102. Численность занятых в экономике страны равно 90 млн. чел., численность безработных – 10 млн. чел.
Рассчитайте уровень безработицы.
- 7 %
- 9 %
- 10%
- 5%
103. Что из перечисленного имеет отношение к инфляции, обусловленной ростом издержек производства:
- рост занятости и производства
- рост процентной ставки
- рост стоимости издержек на единицу продукции
- рост зарплаты
104. Установите последовательность расположения стран по увеличению дифференциации доходов:
- Россия
- Германия
- Норвегия
- Швейцария
- Венесуэла
105. Человек, не имеющий работу, но желающий работать и активно ищущий работу:
- относится к числу занятых
- является экономически не активным
- учитывается в составе рабочей силы
- рассматривается как не полностью занятый
- является безработным
106. Инфляция издержек графически выразится в (укажите не менее двух вариантов ответа):
- сдвиге кривой совокупного предложения вправо
- установлении нового равновесия при большем объеме производства
- установлении нового равновесия при меньшем объеме производства
- сдвиге кривой совокупного предложения влево
107. Потерявший работу из-за спада в экономике попадает в категорию безработных, охваченных:
- застойной формой безработицы
- циклической формой безработицы
- фрикционной формой безработицы
- структурной формой безработицы
108. Установите соответствие между людьми и их статусами в сфере занятости:
- пенсионер, способный работать и активно ищущий работу
- токарь, уволившийся по собственному желанию, чтобы найти более привлекательную работу
- женщина, находящаяся в декретном отпуске
- студент дневного отделения
109. Если номинальный доход повысился на 8%, а уровень цен вырос на 10%, то реальный доход:
- увеличился на 2%
- снизился на 18%
- снизился на 2%
110. Инфляция спроса возникает когда:
- темп роста совокупного спроса превышает темп роста совокупного предложения
- возрастают издержки производства
- в условиях полной занятости растет совокупный спрос
- темп роста совокупного спроса меньше темпа роста совокупного предложения
- снижаются издержки производства
111. Установите соответствие между безработными и видами безработицы:
- работник, уволенный из-за его устаревшей квалификации
- работник, уволенный по собственному желанию
- работник, уволенный по сокращению штатов из-за падения спроса на продукцию предприятия
- уволенный рабочий, который в течение длительного времени не мог найти работу и поэтому прекратил ее поиски
- работник, уволенный с сельскохозяйственной фермы после уборочной компании
112. Если, потеряв работу год назад, Николаев перестал искать её, перебиваясь случайными мелкими заработками, то он пополнил … форму безработицы.
113. При прочих равных условиях увеличение совокупного спроса на переходном отрезке кривой совокупного предложения вызовет:
- рост цен при неизменном реальном объеме производства
- увеличение реального объема национального производства при неизменном уровне цен
- рост цен и увеличение реального объема производства
- инфляцию издержек
114. Стагфляция характеризуется:
- ростом цен, сокращением производства и высоким уровнем безработицы
- сокращением производства и снижением уровня цен
- дефицитом товаров и услуг
- постоянным ростом цены потребительской корзины
115. … — это защита национальных производителей от иностранной конкуренции посредством прямого и косвенного ограничения ввоза товаров.
116. Установите соответствие между понятиями и их стоимостными выражениями:
- стоимость экспорта и импорта
- сумма экспорта всех стран
- отношение импорта к ВВП, выраженное в процентах
- разница экспорта и импорта
- отношение экспорта к ВВП, выраженное в процентах
117. Экспорт и импорт товаров отражается в:
- торговом балансе
- государственном долге
- счете движения капитала платежного баланса
- государственном бюджете
118. Международное разделение труда сопровождается:
- импортозамещением
- организацией экспортного производства
- перемещением части факторов производства в экспортный сектор экономики
- возрастанием зависимости от мирового рынка
- ростом доходов от собственности
119. Паритет покупательной способности национальных валют свидетельствует о том, что с учетом обменного курса:
- колебания реального обменного курса не ограничены
- все товары вовлечены в мировую торговлю
- определенный товар в одно и то же время в любой точке мира должен продаваться по одной цене
- определенный товар в одно и то же время в любой точке мира должен продаваться по разным ценам
120. Для политики протекционизма характерно:
- стимулирование свободы торговли
- импортозамещение
- стимулирование импорта
- стимулирование экспорта
- высокие импортные пошлины
121. Торговый баланс страны является …, если импорт по стоимости превышает экспорт.
122. Если Правительство России снизит пошлины на ввозимые в страну иностранные товары, то в долгосрочном периоде:
- повысится спрос на иностранную валюту и снизится реальный обменный курс рубля
- снизится российский экспорт
- повысится инфляция
- повысится спрос на иностранную валюту и реальный обменный курс рубля
123. В таблице даны показатели внешнеторгового оборота России в 2000-2005 гг. Найти импортную квоту в 2002 г.
124. В таблице даны показатели внешнеторгового оборота России в 2000-2005 гг. Найти сальдо внешней торговли в 2002 г.
125. Установите соответствие между страной и группой стран, к которой она относится:
- Малайзия
- Китай
- Гондурас
- Германия
126. Укажите инструменты внешнеторгового регулирования:
- банковский процент
- лицензирование импорта
- таможенный тариф
- протекционизм
- экспортные квоты
127. Соответствие между характеристиками таможенных пошлин по способу установления и их видами:
- взимаются в виде процента от стоимости облагаемого товара
- вводятся в ответ на субсидирование экспорта в других странах
- взимаются в виде твердой денежной ставки с единицы веса, объема, мощности товара
- взимаются частично в виде процента от стоимости облагаемого товара, и частично в виде твердой денежной ставки с единицы веса, объема, мощности товара
- взимаются для создания благоприятных условий для торговли каким-либо товаром или с какой-либо страной
128. Установите последовательность в порядке возрастания уровня экономического развития стран мировой экономики:
- США
- Замбия
- Россия
- Япония
- Германия
129. Официально установленное соотношение между национальными валютами, при строгом ограничении колебаний рыночных курсов валют – это … валютный курс.
130. Установите последовательность стран в порядке возрастания доли в мировом валовом продукте:
- Китай
- Италия
- Чехия
- Франция
- Япония
131. Если темп инфляции в США будет ниже, чем Японии, то курс:
- доллара по отношению к йене повысится
- йены повысится
- йены не изменится
- доллара по отношению к йене понизится
132. Средством торгового протекционизма является:
- свободная торговля
- таможенные пошлины
- валютный союз
- валютные интервенции
133. Для промышленно развитых стран характерно:
- аграрно-сырьевая ориентация экспорта
- интенсивный тип экономического роста
- ведущее положение в системе мирового хозяйства
- высокий уровень экономического развития
134. К резервным международным валютам можно отнести:
- китайский юань
- СДР
- евро
- доллар США
- российский рубль
Ферма после уборки урожая сократила количество работников. Механизаторы и комбайнеры вновь будут набираться на ферму только весной следующего года. Приведенный пример иллюстрирует безработицу
1) фрикционную
2) сезонную
3) циклическую
4) структурную
Спрятать пояснение
Пояснение.
Дадим определение каждому из вариантов.
Фрикционная безработица — время добровольного поиска работником нового места работы, которое устраивает его в большей степени, нежели прежнее рабочее место.
Сезонная безработица — зависит от колебаний в уровне экономической активности в течение года, характерных для некоторых отраслей экономики.
Циклическая безработица — вызывается повторяющимися спадами производства в стране или регионе. Представляет собой разницу между уровнем безработицы в текущий момент экономического цикла и естественным уровнем безработицы. Для разных стран естественным признаётся разный уровень безработицы.
Структурная безработица — обусловлена изменениями в структуре спроса на труд, когда образуется структурное несовпадение между квалификацией безработных и требованием свободных рабочих мест.
Правильный ответ указан под номером: 2.
Источник: Яндекс: Тренировочная работа ЕГЭ по обществознанию. Вариант 1.
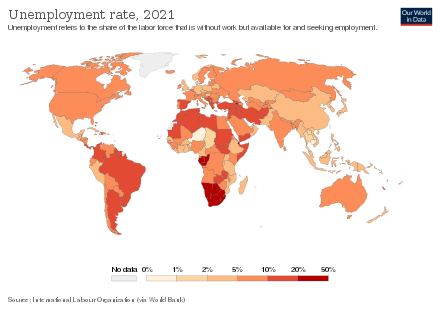
Unemployment rate, 2021[1]
Unemployment, according to the OECD (Organisation for Economic Co-operation and Development), is people above a specified age (usually 15)[2] not being in paid employment or self-employment but currently available for work during the reference period.[3]
Unemployment is measured by the unemployment rate, which is the number of people who are unemployed as a percentage of the labour force (the total number of people employed added to those unemployed).[4]
Unemployment can have many sources, such as the following:
- new technologies and inventions
- the status of the economy, which can be influenced by a recession
- competition caused by globalization and international trade
- policies of the government
- regulation and market
Unemployment and the status of the economy can be influenced by a country through, for example, fiscal policy. Furthermore, the monetary authority of a country, such as the central bank, can influence the availability and cost for money through its monetary policy.
In addition to theories of unemployment, a few categorisations of unemployment are used for more precisely modelling the effects of unemployment within the economic system. Some of the main types of unemployment include structural unemployment, frictional unemployment, cyclical unemployment, involuntary unemployment and classical unemployment. Structural unemployment focuses on foundational problems in the economy and inefficiencies inherent in labor markets, including a mismatch between the supply and demand of laborers with necessary skill sets. Structural arguments emphasize causes and solutions related to disruptive technologies and globalization. Discussions of frictional unemployment focus on voluntary decisions to work based on individuals’ valuation of their own work and how that compares to current wage rates added to the time and effort required to find a job. Causes and solutions for frictional unemployment often address job entry threshold and wage rates.
According to the UN’s International Labour Organization (ILO), there were 172 million people worldwide (or 5% of the reported global workforce) without work in 2018.[5]
Because of the difficulty in measuring the unemployment rate by, for example, using surveys (as in the United States) or through registered unemployed citizens (as in some European countries), statistical figures such as the employment-to-population ratio might be more suitable for evaluating the status of the workforce and the economy if they were based on people who are registered, for example, as taxpayers.[6]
Definitions, types, and theories[edit]

Unemployment in Mexico 2009
The state of being without any work yet looking for work is called unemployment. Economists distinguish between various overlapping types of and theories of unemployment, including cyclical or Keynesian unemployment, frictional unemployment, structural unemployment and classical unemployment definition. Some additional types of unemployment that are occasionally mentioned are seasonal unemployment, hardcore unemployment, and hidden unemployment.
Though there have been several definitions of «voluntary» and «involuntary unemployment» in the economics literature, a simple distinction is often applied. Voluntary unemployment is attributed to the individual’s decisions, but involuntary unemployment exists because of the socio-economic environment (including the market structure, government intervention, and the level of aggregate demand) in which individuals operate. In these terms, much or most of frictional unemployment is voluntary since it reflects individual search behavior. Voluntary unemployment includes workers who reject low-wage jobs, but involuntary unemployment includes workers fired because of an economic crisis, industrial decline, company bankruptcy, or organizational restructuring.
On the other hand, cyclical unemployment, structural unemployment, and classical unemployment are largely involuntary in nature. However, the existence of structural unemployment may reflect choices made by the unemployed in the past, and classical (natural) unemployment may result from the legislative and economic choices made by labour unions or political parties.
The clearest cases of involuntary unemployment are those with fewer job vacancies than unemployed workers even when wages are allowed to adjust and so even if all vacancies were to be filled, some unemployed workers would still remain. That happens with cyclical unemployment, as macroeconomic forces cause microeconomic unemployment, which can boomerang back and exacerbate those macroeconomic forces.
Real wage unemployment[edit]
Classical, natural, or real-wage unemployment, occurs when real wages for a job are set above the market-clearing level, causing the number of job-seekers to exceed the number of vacancies. On the other hand, most economists argue that as wages fall below a livable wage, many choose to drop out of the labour market and no longer seek employment. That is especially true in countries in which low-income families are supported through public welfare systems. In such cases, wages would have to be high enough to motivate people to choose employment over what they receive through public welfare. Wages below a livable wage are likely to result in lower labor market participation in the above-stated scenario. In addition, consumption of goods and services is the primary driver of increased demand for labor. Higher wages lead to workers having more income available to consume goods and services. Therefore, higher wages increase general consumption and as a result demand for labor increases and unemployment decreases.
Many economists[who?] have argued that unemployment increases with increased governmental regulation. For example, minimum wage laws raise the cost of some low-skill laborers above market equilibrium, resulting in increased unemployment as people who wish to work at the going rate cannot (as the new and higher enforced wage is now greater than the value of their labour).[7][8] Laws restricting layoffs may make businesses less likely to hire in the first place, as hiring becomes more risky.[8]
However, that argument overly simplifies the relationship between wage rates and unemployment by ignoring numerous factors that contribute to unemployment.[9][10][11][12][13] Some, such as Murray Rothbard, suggest that even social taboos can prevent wages from falling to the market-clearing level.[14]
In Out of Work: Unemployment and Government in the Twentieth-Century America, economists Richard Vedder and Lowell Gallaway argue that the empirical record of wages rates, productivity, and unemployment in America validates classical unemployment theory. Their data shows a strong correlation between adjusted real wage and unemployment in the United States from 1900 to 1990. However, they maintain that their data does not take into account exogenous events.[15]
Cyclical unemployment[edit]

US unemployment rate, 1990—2022. The increase in unemployment during recessions (shaded) is called cyclical unemployment.
Cyclical, deficient-demand, or Keynesian unemployment occurs when there is not enough aggregate demand in the economy to provide jobs for everyone who wants to work. Demand for most goods and services falls, less production is needed and consequently, fewer workers are needed, wages are sticky and do not fall to meet the equilibrium level, and unemployment results.[16] Its name is derived from the frequent ups and downs in the business cycle, but unemployment can also be persistent, such as during the Great Depression.
With cyclical unemployment, the number of unemployed workers exceeds the number of job vacancies and so even if all open jobs were filled, some workers would still remain unemployed. Some associate cyclical unemployment with frictional unemployment because the factors that cause the friction are partially caused by cyclical variables. For example, a surprise decrease in the money supply may suddenly inhibit aggregate demand and thus inhibit labor demand.
Keynesian economists, on the other hand, see the lack of supply of jobs as potentially resolvable by government intervention. One suggested intervention involves deficit spending to boost employment and goods demand. Another intervention involves an expansionary monetary policy to increase the supply of money, which should reduce interest rates, which, in turn, should lead to an increase in non-governmental spending.[17]
Unemployment under «full employment»[edit]
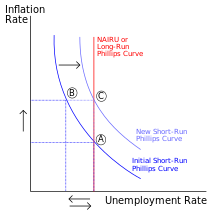
Short-run Phillips curve before and after Expansionary Policy, with Long-Run Phillips Curve (NAIRU). Note, however, that the unemployment rate is an inaccurate predictor of inflation in the long term.[18][19]
In demands based theory, it is possible to abolish cyclical unemployment by increasing the aggregate demand for products and workers. However, the economy eventually hits an «inflation barrier» that is imposed by the four other kinds of unemployment to the extent that they exist. Historical experience suggests that low unemployment affects inflation in the short term but not the long term.[18] In the long term, the velocity of money supply measures such as the MZM («money zero maturity», representing cash and equivalent demand deposits) velocity is far more predictive of inflation than low unemployment.[19][20]
Some demand theory economists see the inflation barrier as corresponding to the natural rate of unemployment. The «natural» rate of unemployment is defined as the rate of unemployment that exists when the labour market is in equilibrium, and there is pressure for neither rising inflation rates nor falling inflation rates. An alternative technical term for that rate is the NAIRU, the Non-Accelerating Inflation Rate of Unemployment. Whatever its name, demand theory holds that if the unemployment rate gets «too low,» inflation will accelerate in the absence of wage and price controls (incomes policies).
One of the major problems with the NAIRU theory is that no one knows exactly what the NAIRU is, and it clearly changes over time.[18] The margin of error can be quite high relative to the actual unemployment rate, making it hard to use the NAIRU in policy-making.[19]
Another, normative, definition of full employment might be called the ideal unemployment rate. It would exclude all types of unemployment that represent forms of inefficiency. This type of «full employment» unemployment would correspond to only frictional unemployment (excluding that part encouraging the McJobs management strategy) and so would be very low. However, it would be impossible to attain this full-employment target using only demand-side Keynesian stimulus without getting below the NAIRU and causing accelerating inflation (absent incomes policies). Training programs aimed at fighting structural unemployment would help here.
To the extent that hidden unemployment exists, it implies that official unemployment statistics provide a poor guide to what unemployment rate coincides with «full employment.»[18]
Structural unemployment[edit]

Okun’s Law interprets unemployment as a function of the rate of growth in GDP.
Structural unemployment occurs when a labour market is unable to provide jobs for everyone who wants one because there is a mismatch between the skills of the unemployed workers and the skills needed for the available jobs. Structural unemployment is hard to separate empirically from frictional unemployment except that it lasts longer. As with frictional unemployment, simple demand-side stimulus will not work to abolish this type of unemployment easily.
Structural unemployment may also be encouraged to rise by persistent cyclical unemployment: if an economy suffers from longlasting low aggregate demand, it means that many of the unemployed become disheartened, and their skills (including job-searching skills) become «rusty» and obsolete. Problems with debt may lead to homelessness and a fall into the vicious circle of poverty.
That means that they may not fit the job vacancies that are created when the economy recovers. The implication is that sustained high demand may lower structural unemployment. This theory of persistence in structural unemployment has been referred to as an example of path dependence or «hysteresis.»
Much technological unemployment,[21] caused by the replacement of workers by machines might be counted as structural unemployment. Alternatively, technological unemployment might refer to the way in which steady increases in labour productivity mean that fewer workers are needed to produce the same level of output every year. The fact that aggregate demand can be raised to deal with the problem suggests that the problem is instead one of cyclical unemployment. As indicated by Okun’s law, the demand side must grow sufficiently quickly to absorb not only the growing labour force but also the workers who are made redundant by the increased labour productivity.
Seasonal unemployment may be seen as a kind of structural unemployment since it is linked to certain kinds of jobs (construction and migratory farm work). The most-cited official unemployment measures erase this kind of unemployment from the statistics using «seasonal adjustment» techniques. That results in substantial and permanent structural unemployment.
Frictional unemployment[edit]

Frictional unemployment is the time period between jobs in which a worker searches for or transitions from one job to another. It is sometimes called search unemployment and can be voluntary, based on the circumstances of the unemployed individual. Frictional unemployment exists because both jobs and workers are heterogeneous, and a mismatch can result between the characteristics of supply and demand. Such a mismatch can be related to skills, payment, work-time, location, seasonal industries, attitude, taste, and a multitude of other factors. New entrants (such as graduating students) and re-entrants (such as former homemakers) can also suffer a spell of frictional unemployment.
Workers and employers accept a certain level of imperfection, risk or compromise, but usually not right away. They will invest some time and effort to find a better match. That is, in fact, beneficial to the economy since it results in a better allocation of resources. However, if the search takes too long and mismatches are too frequent, the economy suffers since some work will not get done. Therefore, governments will seek ways to reduce unnecessary frictional unemployment by multiple means including providing education, advice, training, and assistance such as daycare centers.
The frictions in the labour market are sometimes illustrated graphically with a Beveridge curve, a downward-sloping, convex curve that shows a correlation between the unemployment rate on one axis and the vacancy rate on the other. Changes in the supply of or demand for labour cause movements along the curve. An increase or decrease in labour market frictions will shift the curve outwards or inwards.
Hidden unemployment[edit]
Official statistics often underestimate unemployment rates because of hidden, or covered, unemployment.[22] That is the unemployment of potential workers that are not reflected in official unemployment statistics because of how the statistics are collected. In many countries, only those who have no work but are actively looking for work and/or qualifying for social security benefits are counted as unemployed. Those who have given up looking for work and sometimes those who are on government «retraining» programs are not officially counted among the unemployed even though they are not employed.
The statistic also does not count the «underemployed», those working fewer hours than they would prefer or in a job that fails to make good use of their capabilities. In addition, those who are of working age but are currently in full-time education are usually not considered unemployed in government statistics. Traditional unemployed native societies who survive by gathering, hunting, herding, and farming in wilderness areas may or may not be counted in unemployment statistics.
Long-term unemployment[edit]
Long-term unemployment (LTU) is defined in European Union statistics as unemployment lasting for longer than one year (while unemployment lasting over two years is defined as very long-term unemployment). The United States Bureau of Labor Statistics (BLS), which reports current long-term unemployment rate at 1.9 percent, defines this as unemployment lasting 27 weeks or longer. Long-term unemployment is a component of structural unemployment, which results in long-term unemployment existing in every social group, industry, occupation, and all levels of education.[23]
In 2015 the European Commission published recommendations on how to reduce long-term unemployment.[24] These advised governments to:
- encourage long-term unemployed people to register with an employment service;
- provide each registered long-term unemployed person with an individual in-depth assessment to identify their needs and potential within 18 months;
- offer a tailor-made job integration agreement (JIA) to all registered long-term unemployed within 18 months. These might include measures such as mentoring, help with job search, further education and training, support for housing, transport, child and care services and rehabilitation. Each person would have a single point of contact to access this support, which would be implemented in partnership with employers.
In 2017–2019 it implemented the Long-Term Unemployment project to research solutions implemented by EU member states and produce a toolkit[25] to guide government action. Progress was evaluated[26] in 2019.
Marxian theory of unemployment[edit]

It is in the very nature of the capitalist mode of production to overwork some workers while keeping the rest as a reserve army of unemployed paupers.
Marxists share the Keynesian viewpoint of the relationship between economic demand and employment, but with the caveat that the market system’s propensity to slash wages and reduce labor participation on an enterprise level causes a requisite decrease in aggregate demand in the economy as a whole, causing crises of unemployment and periods of low economic activity before the capital accumulation (investment) phase of economic growth can continue. According to Karl Marx, unemployment is inherent within the unstable capitalist system and periodic crises of mass unemployment are to be expected. He theorized that unemployment was inevitable and even a necessary part of the capitalist system, with recovery and regrowth also part of the process.[28] The function of the proletariat within the capitalist system is to provide a «reserve army of labour» that creates downward pressure on wages. This is accomplished by dividing the proletariat into surplus labour (employees) and under-employment (unemployed).[29] This reserve army of labour fight among themselves for scarce jobs at lower and lower wages. At first glance, unemployment seems inefficient since unemployed workers do not increase profits, but unemployment is profitable within the global capitalist system because unemployment lowers wages which are costs from the perspective of the owners. From this perspective low wages benefit the system by reducing economic rents. Yet, it does not benefit workers; according to Karl Marx, the workers (proletariat) work to benefit the bourgeoisie through their production of capital.[30] Capitalist systems unfairly manipulate the market for labour by perpetuating unemployment which lowers laborers’ demands for fair wages. Workers are pitted against one another at the service of increasing profits for owners. As a result of the capitalist mode of production, Marx argued that workers experienced alienation and estrangement through their economic identity.[31] According to Marx, the only way to permanently eliminate unemployment would be to abolish capitalism and the system of forced competition for wages and then shift to a socialist or communist economic system. For contemporary Marxists, the existence of persistent unemployment is proof of the inability of capitalism to ensure full employment.[32]
Measurement[edit]
There are also different ways national statistical agencies measure unemployment. The differences may limit the validity of international comparisons of unemployment data.[33] To some degree, the differences remain despite national statistical agencies increasingly adopting the definition of unemployment of the International Labour Organization.[34] To facilitate international comparisons, some organizations, such as the OECD, Eurostat, and International Labor Comparisons Program, adjust data on unemployment for comparability across countries.
Though many people care about the number of unemployed individuals, economists typically focus on the unemployment rate, which corrects for the normal increase in the number of people employed caused by increases in population and increases in the labour force relative to the population. The unemployment rate is expressed as a percentage and calculated as follows:

As defined by the International Labour Organization, «unemployed workers» are those who are currently not working but are willing and able to work for pay, currently available to work, and have actively searched for work.[35]
Individuals who are actively seeking job placement must make the effort to be in contact with an employer, have job interviews, contact job placement agencies, send out resumes, submit applications, respond to advertisements, or some other means of active job searching within the prior four weeks. Simply looking at advertisements and not responding will not count as actively seeking job placement. Since not all unemployment may be «open» and counted by government agencies, official statistics on unemployment may not be accurate.[36] In the United States, for example, the unemployment rate does not take into consideration those individuals who are not actively looking for employment, such as those who are still attending college.[37]
According to the OECD, Eurostat, and the US Bureau of Labor Statistics the unemployment rate is the number of unemployed people as a percentage of the labour force.
«An unemployed person is defined by Eurostat, according to the guidelines of the International Labour Organization, as:
- someone aged 15 to 74 (in Italy, Spain, the United Kingdom, Iceland, Norway: 16 to 74 years);
- without work during the reference week;
- available to start work within the next two weeks (or has already found a job to start within the next three months);
- actively having sought employment at some time during the last four weeks.»[38]
The labour force, or workforce, includes both employed (employees and self-employed) and unemployed people but not the economically inactive, such as pre-school children, school children, students and pensioners.[39]
The unemployment rate of an individual country is usually calculated and reported on a monthly, quarterly, and yearly basis by the National Agency of Statistics. Organisations like the OECD report statistics for all of its member states.[40]
Certain countries provide unemployment compensation for a certain period of time for unemployed citizens who are registered as unemployed at the government employment agency. Furthermore, pension receivables or claims could depend on the registration at the government employment agency.[41][42]
In many countries like in Germany, the unemployment rate is based on the number of people who are registered as unemployed.[43] Other countries like the United States use a labour force survey to calculate the unemployment rate.[44][45]
The ILO describes four different methods to calculate the unemployment rate:[46]
- Labour Force Sample Surveys are the most preferred method of unemployment rate calculation since they give the most comprehensive results and enables calculation of unemployment by different group categories such as race and gender. This method is the most internationally comparable.
- Official Estimates are determined by a combination of information from one or more of the other three methods. The use of this method has been declining in favor of labour surveys.
- Social Insurance Statistics, such as unemployment benefits, are computed base on the number of persons insured representing the total labour force and the number of persons who are insured that are collecting benefits. This method has been heavily criticized because if the expiration of benefits before the person finds work.
- Employment Office Statistics are the least effective since they include only a monthly tally of unemployed persons who enter employment offices. This method also includes those who are not unemployed by the ILO definition.
The primary measure of unemployment, U3, allows for comparisons between countries. Unemployment differs from country to country and across different time periods. For example, in the 1990s and 2000s, the United States had lower unemployment levels than many countries in the European Union,[47] which had significant internal variation, with countries like the United Kingdom and Denmark outperforming Italy and France. However, large economic events like the Great Depression can lead to similar unemployment rates across the globe.
In 2013, the ILO adopted a resolution to introduce new indicators to measure the unemployment rate.[48]
- LU1: Unemployment rate: [persons in unemployment / labour force] × 100
- LU2: Combined rate of time-related underemployment and unemployment: [(persons in time-related underemployment + persons in unemployment) / labour force]
x 100
- LU3: Combined rate of unemployment and potential labour force: [(persons in unemployment + potential labour force) / (extended labour force)] × 100
- LU4: Composite measure of labour underutilization: [(persons in time-related underemployment + persons in unemployment + potential
labour force) / (extended labour force)] × 100
European Union (Eurostat)[edit]
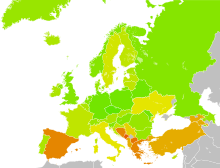
Unemployment in Europe (2020) according to Worldbank

Unemployment rates from 2000–2019 for United States, Japan and European Union
Eurostat, the statistical office of the European Union, defines unemployed as those persons between age 15 and 74 who are not working, have looked for work in the last four weeks, and are ready to start work within two weeks; this definition conforms to ILO standards. Both the actual count and the unemployment rate are reported. Statistical data are available by member state for the European Union as a whole (EU28) as well as for the eurozone (EA19). Eurostat also includes a long-term unemployment rate, which is defined as part of the unemployed who have been unemployed for more than one year.[49]
The main source used is the European Union Labour Force Survey (EU-LFS). It collects data on all member states each quarter. For monthly calculations, national surveys or national registers from employment offices are used in conjunction with quarterly EU-LFS data. The exact calculation for individual countries, resulting in harmonized monthly data, depends on the availability of the data.[50]
United States Bureau of Labor statistics[edit]

Unemployment rate in the US by county in 2008[51]
1.2–3%
3.1–4%
4.1–5%
5.1–6%
6.1–7%
7.1–8%
8.1–9%
9.1–10%
10.1–11%
11.1–13%
13.1–22.9%
The Bureau of Labor Statistics measures employment and unemployment (of those over 17 years of age) by using two different labor force surveys[52] conducted by the United States Census Bureau (within the United States Department of Commerce) and/or the Bureau of Labor Statistics (within the United States Department of Labor) that gather employment statistics monthly. The Current Population Survey (CPS), or «Household Survey,» conducts a survey based on a sample of 60,000 households. The survey measures the unemployment rate based on the ILO definition.[53]
The Current Employment Statistics survey (CES), or «Payroll Survey,» conducts a survey based on a sample of 160,000 businesses and government agencies, which represent 400,000 individual employers.[54] Since the survey measures only civilian nonagricultural employment, it does not calculate an unemployment rate, and it differs from the ILO unemployment rate definition. Both sources have different classification criteria and usually produce differing results. Additional data are also available from the government, such as the unemployment insurance weekly claims report available from the Office of Workforce Security, within the U.S. Department of Labor’s Employment and Training Administration.[55] The Bureau of Labor Statistics provides up-to-date numbers via a PDF linked here.[56] The BLS also provides a readable concise current Employment Situation Summary, updated monthly.[57]

U1–U6 since 1950, as reported by the Bureau of Labor Statistics
The Bureau of Labor Statistics also calculates six alternate measures of unemployment, U1 to U6, which measure different aspects of unemployment:[58]
- U1:[59] Percentage of labor force unemployed 15 weeks or longer.
- U2: Percentage of labor force who lost jobs or completed temporary work.
- U3: Official unemployment rate, per the ILO definition, occurs when people are without jobs and they have actively looked for work within the past four weeks.[60]
- U4: U3 + «discouraged workers», or those who have stopped looking for work because current economic conditions make them believe that no work is available for them.
- U5: U4 + other «marginally attached workers,» or «loosely attached workers,» or those who «would like» and are able to work but have not looked for work recently.
- U6: U5 + Part-time workers who want to work full-time, but cannot for economic reasons (underemployment).
Note: «Marginally attached workers» are added to the total labour force for unemployment rate calculation for U4, U5, and U6. The BLS revised the CPS in 1994 and among the changes the measure representing the official unemployment rate was renamed U3 instead of U5.[61] In 2013, Representative Hunter proposed that the Bureau of Labor Statistics use the U5 rate instead of the current U3 rate.[62]
Statistics for the US economy as a whole hide variations among groups. For example, in January 2008, the US unemployment rates were 4.4% for adult men, 4.2% for adult women, 4.4% for Caucasians, 6.3% for Hispanics or Latinos (all races), 9.2% for African Americans, 3.2% for Asian Americans, and 18.0% for teenagers.[54] Also, the US unemployment rate would be at least 2% higher if prisoners and jail inmates were counted.[63][64]
The unemployment rate is included in a number of major economic indices including the US Conference Board’s Index of Leading Indicators a macroeconomic measure of the state of the economy.

Estimated US unemployment rate from 1800–1890. All data are estimates based on data compiled by Lebergott.[65] See limitations section below on how to interpret unemployment statistics in self-employed, agricultural economies. See image information for complete data.
Alternatives[edit]
Limitations of definition[edit]
Some critics believe that current methods of measuring unemployment are inaccurate in terms of the impact of unemployment on people as these methods do not take into account the 1.5% of the available working population incarcerated in US prisons (who may or may not be working while they are incarcerated); those who have lost their jobs and have become discouraged over time from actively looking for work; those who are self-employed or wish to become self-employed, such as tradesmen or building contractors or information technology consultants; those who have retired before the official retirement age but would still like to work (involuntary early retirees); those on disability pensions who do not possess full health but still wish to work in occupations that suitable for their medical conditions; or those who work for payment for as little as one hour per week but would like to work full time.[70]
The last people are «involuntary part-time» workers, those who are underemployed, such as a computer programmer who is working in a retail store until he can find a permanent job, involuntary stay-at-home mothers who would prefer to work, and graduate and professional school students who are unable to find worthwhile jobs after they graduated with their bachelor’s degrees.

Internationally, some nations’ unemployment rates are sometimes muted or appear less severe because of the number of self-employed individuals working in agriculture.[65] Small independent farmers are often considered self-employed and so cannot be unemployed. That can impact non-industrialized economies, such as the United States and Europe in the early 19th century, since overall unemployment was approximately 3% because so many individuals were self-employed, independent farmers; however, non-agricultural unemployment was as high as 80%.[65]
Many economies industrialize and so experience increasing numbers of non-agricultural workers. For example, the United States’ non-agricultural labour force increased from 20% in 1800 to 50% in 1850 and 97% in 2000.[65] The shift away from self-employment increases the percentage of the population that is included in unemployment rates. When unemployment rates between countries or time periods are compared, it is best to consider differences in their levels of industrialization and self-employment.
Additionally, the measures of employment and unemployment may be «too high.» In some countries, the availability of unemployment benefits can inflate statistics by giving an incentive to register as unemployed. People who do not seek work may choose to declare themselves unemployed to get benefits; people with undeclared paid occupations may try to get unemployment benefits in addition to the money that they earn from their work.[71]
However, in the United States, Canada, Mexico, Australia, Japan, and the European Union, unemployment is measured using a sample survey (akin to a Gallup poll).[34] According to the BLS, a number of Eastern European nations have instituted labour force surveys as well. The sample survey has its own problems because the total number of workers in the economy is calculated based on a sample, rather than a census.
It is possible to be neither employed nor unemployed by ILO definitions by being outside of the «labour force.»[36] Such people have no job and are not looking for one. Many of them go to school or are retired. Family responsibilities keep others out of the labour force. Still others have a physical or mental disability that prevents them from participating in the labour force. Some people simply elect not to work and prefer to be dependent on others for sustenance.
Typically, employment and the labour force include only work that is done for monetary gain. Hence, a homemaker is neither part of the labour force nor unemployed. Also, full-time students and prisoners are considered to be neither part of the labour force nor unemployed.[70] The number of prisoners can be important. In 1999, economists Lawrence F. Katz and Alan B. Krueger estimated that increased incarceration lowered measured unemployment in the United States by 0.17% between 1985 and the late 1990s.[70]
In particular, as of 2005, roughly 0.7% of the US population is incarcerated (1.5% of the available working population). Additionally, children, the elderly, and some individuals with disabilities are typically not counted as part of the labour force and so are not included in the unemployment statistics. However, some elderly and many disabled individuals are active in the labour market.
In the early stages of an economic boom, unemployment often rises.[16] That is because people join the labour market (give up studying, start a job hunt, etc.) as a result of the improving job market, but until they have actually found a position, they are counted as unemployed. Similarly, during a recession, the increase in the unemployment rate is moderated by people leaving the labour force or being otherwise discounted from the labour force, such as with the self-employed.
For the fourth quarter of 2004, according to OECD (Employment Outlook 2005 ISBN 92-64-01045-9), normalized unemployment for men aged 25 to 54 was 4.6% in the US and 7.4% in France. At the same time and for the same population, the employment rate (number of workers divided by population) was 86.3% in the US and 86.7% in France. That example shows that the unemployment rate was 60% higher in France than in the US, but more people in that demographic were working in France than in the US, which is counterintuitive if it is expected that the unemployment rate reflects the health of the labour market.[72][73]
Those deficiencies make many labour market economists prefer to look at a range of economic statistics such as labour market participation rate, the percentage of people between 15 and 64 who are currently employed or searching for employment, the total number of full-time jobs in an economy, the number of people seeking work as a raw number and not a percentage, and the total number of person-hours worked in a month compared to the total number of person-hours people would like to work. In particular, the National Bureau of Economic Research does not use the unemployment rate but prefers various employment rates to date recessions.[74]
Labor force participation rate[edit]
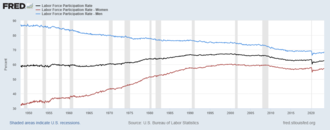
US labor force participation rate from 1948 to 2021, by gender
Male participation
Total labor force participation
Female participation
The labor force participation rate is the ratio between the labor force and the overall size of their cohort (national population of the same age range). In the West, during the later half of the 20th century, the labor force participation rate increased significantly because of an increase in the number of women entering the workplace.
In the United States, there have been four significant stages of women’s participation in the labour force: increases in the 20th century and decreases in the 21st century. Male labor force participation decreased from 1953 to 2013. Since October 2013, men have been increasingly joining the labour force.
From the late 19th century to the 1920s, very few women worked outside the home. They were young single women who typically withdrew from the labor force at marriage unless family needed two incomes. Such women worked primarily in the textile manufacturing industry or as domestic workers. That profession empowered women and allowed them to earn a living wage. (Source on women earning a living wage?) At times, they were a financial help to their families.
Between 1930 and 1950, female labor force participation increased primarily because of the increased demand for office workers, women’s participation in the high school movement, and electrification, which reduced the time that was spent on household chores. From the 1950s to the early 1970s, most women were secondary earners working mainly as secretaries, teachers, nurses, and librarians (pink-collar jobs).
From the mid-1970s to the late 1990s, there was a period of revolution of women in the labor force brought on by various factors, many of which arose from the second-wave feminism movement. Women more accurately planned for their future in the work force by investing in more applicable majors in college that prepared them to enter and compete in the labor market. In the United States, the female labor force participation rate rose from approximately 33% in 1948 to a peak of 60.3% in 2000. As of April 2015, the female labor force participation is at 56.6%, the male labor force participation rate is at 69.4%, and the total is 62.8%.[75]
A common theory in modern economics claims that the rise of women participating in the US labor force in the 1950s to the 1990s was caused by the introduction of a new contraceptive technology, birth control pills, as well as the adjustment of age of majority laws. The use of birth control gave women the flexibility of opting to invest and to advance their career while they maintained a relationship. By having control over the timing of their fertility, they were not running a risk of thwarting their career choices. However, only 40% of the population actually used the birth control pill.
That implies that other factors may have contributed to women choosing to invest in advancing their careers. One factor may be that an increasing number of men delayed the age of marriage, which allowed women to marry later in life without them worrying about the quality of older men. Other factors include the changing nature of work, with machines replacing physical labor, thus eliminating many traditional male occupations, and the rise of the service sector in which many jobs are gender neutral.
Another factor that may have contributed to the trend was the Equal Pay Act of 1963, which aimed at abolishing wage disparity based on sex. Such legislation diminished sexual discrimination and encouraged more women to enter the labor market by receiving fair remuneration to help raising families and children.
At the turn of the 21st century, the labor force participation began to reverse its long period of increase. Reasons for the change include a rising share of older workers, an increase in school enrollment rates among young workers, and a decrease in female labor force participation.[76]
The labor force participation rate can decrease when the rate of growth of the population outweighs that of the employed and the unemployed together. The labor force participation rate is a key component in long-term economic growth, almost as important as productivity.
A historic shift began around the end of the Great Recession as women began leaving the labor force in the United States and other developed countries. The female labor force participation rate in the United States has steadily decreased since 2009, and as of April 2015, the female labor force participation rate has gone back down to 1988 levels of 56.6%.[75]
Participation rates are defined as follows:
| Pop = total population | LF = labor force = U + E |
| LFpop = labor force population (generally defined as all men and women aged 15–64) |
p = participation rate = LF / LFpop |
| E = number employed | e = rate of employment = E / LFpop |
| U = number of unemployed | u = rate of unemployment = U / LF |
The labor force participation rate explains how an increase in the unemployment rate can occur simultaneously with an increase in employment. If a large number of new workers enter the labor force but only a small fraction become employed, then the increase in the number of unemployed workers can outpace the growth in employment.[77]
Unemployment-to-population ratio[edit]
The unemployment-to-population ratio calculates the share of unemployed for the whole population. This is in contrast to the unemployment rate, which calculates the percentage of unemployed persons in relation to the active population. Particularly, many young people between 15 and 24 are studying full-time and so are neither working nor looking for a job. That means that they are not part of the labor force, which is used as the denominator when the unemployment rate is calculated.[78]
The youth unemployment ratios in the European Union range from 5.2 (Austria) to 20.6 percent (Spain). They are considerably lower than the standard youth unemployment rates, ranging from 7.9 (Germany) to 57.9 percent (Greece).[79]
Effects[edit]
High and the persistent unemployment, in which economic inequality increases, has a negative effect on subsequent long-run economic growth. Unemployment can harm growth because it is a waste of resources; generates redistributive pressures and subsequent distortions; drives people to poverty; constrains liquidity limiting labor mobility; and erodes self-esteem promoting social dislocation, unrest, and conflict.[80] The 2013 winner of the Nobel Prize in Economics, Robert J. Shiller, said that rising inequality in the United States and elsewhere is the most important problem.[81]
Costs[edit]
Individual[edit]

Unemployed individuals are unable to earn money to meet financial obligations. Failure to pay mortgage payments or to pay rent may lead to homelessness through foreclosure or eviction.[82] Across the United States the growing ranks of people made homeless in the foreclosure crisis are generating tent cities.[83]
Unemployment increases susceptibility to cardiovascular disease, somatization, anxiety disorders, depression, and suicide. In addition, unemployed people have higher rates of medication use, poor diet, physician visits, tobacco smoking, alcoholic beverage consumption, drug use, and lower rates of exercise.[84] According to a study published in Social Indicator Research, even those who tend to be optimistic find it difficult to look on the bright side of things when unemployed. Using interviews and data from German participants aged 16 to 94, including individuals coping with the stresses of real life and not just a volunteering student population, the researchers determined that even optimists struggled with being unemployed.[85]
In 1979, M. Harvey Brenner found that for every 10% increase in the number of unemployed, there is an increase of 1.2% in total mortality, a 1.7% increase in cardiovascular disease, 1.3% more cirrhosis cases, 1.7% more suicides, 4.0% more arrests, and 0.8% more assaults reported to the police.[86][87]
A study by Christopher Ruhm in 2000 on the effect of recessions on health found that several measures of health actually improve during recessions.[88] As for the impact of an economic downturn on crime, during the Great Depression, the crime rate did not decrease. The unemployed in the US often use welfare programs such as food stamps or accumulating debt because unemployment insurance in the US generally does not replace most of the income that was received on the job, and one cannot receive such aid indefinitely.
Not everyone suffers equally from unemployment. In a prospective study of 9,570 individuals over four years, highly-conscientious people suffered more than twice as much if they became unemployed.[89] The authors suggested that may because of conscientious people making different attributions about why they became unemployed or through experiencing stronger reactions following failure. There is also the possibility of reverse causality from poor health to unemployment.[90]
Some researchers hold that many of the low-income jobs are not really a better option than unemployment with a welfare state, with its unemployment insurance benefits. However, since it is difficult or impossible to get unemployment insurance benefits without having worked in the past, those jobs and unemployment are more complementary than they are substitutes. (They are often held short-term, either by students or by those trying to gain experience; turnover in most low-paying jobs is high.)
Another cost for the unemployed is that the combination of unemployment, lack of financial resources, and social responsibilities may push unemployed workers to take jobs that do not fit their skills or allow them to use their talents. Unemployment can cause underemployment, and fear of job loss can spur psychological anxiety. As well as anxiety, it can cause depression, lack of confidence, and huge amounts of stress, which is increased when the unemployed are faced with health issues, poverty, and lack of relational support.[91]
Another personal cost of unemployment is its impact on relationships. A 2008 study from Covizzi, which examined the relationship between unemployment and divorce, found that the rate of divorce is greater for couples when one partner is unemployed.[92] However, a more recent study has found that some couples often stick together in «unhappy» or «unhealthy» marriages when they are unemployed to buffer financial costs.[93] A 2014 study by Van der Meer found that the stigma that comes from being unemployed affects personal well-being, especially for men, who often feel as though their masculine identities are threatened by unemployment.[94]
Unemployment can also bring personal costs in relation to gender. One study found that women are more likely to experience unemployment than men and that they are less likely to move from temporary positions to permanent positions.[95] Another study on gender and unemployment found that men, however, are more likely to experience greater stress, depression, and adverse effects from unemployment, largely stemming from the perceived threat to their role as breadwinner.[96] The study found that men expect themselves to be viewed as «less manly» after a job loss than they actually are and so they engage in compensating behaviors, such as financial risk-taking and increased assertiveness. Unemployment has been linked to extremely adverse effects on men’s mental health.[97] Professor Ian Hickie of the University of Sydney said that evidence showed that men have more restricted social networks than women and that men have are heavily work-based. Therefore, the loss of a job for men means the loss of a whole set of social connections as well. That loss can then lead to men becoming socially isolated very quickly.[98] An Australian study on the mental health impacts of graduating during an economic downturn found that the negative mental health outcomes are greater and more scarring for men than women. The effect was particularly pronounced for those with vocational or secondary education.[99]
Costs of unemployment also vary depending on age. The young and the old are the two largest age groups currently experiencing unemployment.[100] A 2007 study from Jacob and Kleinert found that young people (ages 18 to 24) who have fewer resources and limited work experiences are more likely to be unemployed.[101] Other researchers have found that today’s high school seniors place a lower value on work than those in the past, which is likely because they recognize the limited availability of jobs.[102] At the other end of the age spectrum, studies have found that older individuals have more barriers than younger workers to employment, require stronger social networks to acquire work, and are also less likely to move from temporary to permanent positions.[95][100] Additionally, some older people see age discrimination as the reason for them not getting hired.[103]
[edit]

An economy with high unemployment is not using all of the resources, specifically labour, available to it. Since it is operating below its production possibility frontier, it could have higher output if all of the workforce were usefully employed. However, there is a tradeoff between economic efficiency and unemployment: if all frictionally unemployed accepted the first job that they were offered, they would be likely to be operating at below their skill level, reducing the economy’s efficiency.[104]
During a long period of unemployment, workers can lose their skills, causing a loss of human capital. Being unemployed can also reduce the life expectancy of workers by about seven years.[8]
High unemployment can encourage xenophobia and protectionism since workers fear that foreigners are stealing their jobs.[105] Efforts to preserve existing jobs of domestic and native workers include legal barriers against «outsiders» who want jobs, obstacles to immigration, and/or tariffs and similar trade barriers against foreign competitors.
High unemployment can also cause social problems such as crime. If people have less disposable income than before, it is very likely that crime levels within the economy will increase.
A 2015 study published in The Lancet, estimates that unemployment causes 45,000 suicides a year globally.[106]
Sociopolitical[edit]

High levels of unemployment can be causes of civil unrest,[107] in some cases leading to revolution, particularly totalitarianism. The fall of the Weimar Republic in 1933 and Adolf Hitler’s rise to power, which culminated in World War II and the deaths of tens of millions and the destruction of much of the physical capital of Europe, is attributed to the poor economic conditions in Germany at the time, notably a high unemployment rate[108] of above 20%; see Great Depression in Central Europe for details.
However the hyperinflation in the Weimar Republic is not directly blamed for the Nazi rise. Hyperinflation occurred primarily in 1921 to 1923, the year of Hitler’s Beer Hall Putsch. Although hyperinflation has been blamed for damaging the credibility of democratic institutions, the Nazis did not assume government until 1933, ten years after the hyperinflation but in the midst of high unemployment.
Rising unemployment has traditionally been regarded by the public and the media in any country as a key guarantor of electoral defeat for any government that oversees it. That was very much the consensus in the United Kingdom until 1983, when Thatcher’s Conservative government won a landslide in the general election, despite overseeing a rise in unemployment from 1.5 million to 3.2 million since the 1979 election.[109]
Benefits[edit]
The primary benefit of unemployment is that people are available for hire, without being headhunted away from their existing employers. That permits both new and old businesses to take on staff.
Unemployment is argued to be «beneficial» to the people who are not unemployed in the sense that it averts inflation, which itself has damaging effects, by providing (in Marxian terms) a reserve army of labour, which keeps wages in check.[110] However, the direct connection between full local employment and local inflation has been disputed by some because of the recent increase in international trade that supplies low-priced goods even while local employment rates rise to full employment.[111]

In the Shapiro–Stiglitz model of efficiency wages, workers are paid at a level that dissuades shirking. That prevents wages from dropping to market clearing levels.
Full employment cannot be achieved because workers would shirk if they were not threatened with the possibility of unemployment.[112] The curve for the no-shirking condition (labelled NSC) thus goes to infinity at full employment. The inflation-fighting benefits to the entire economy arising from a presumed optimum level of unemployment have been studied extensively.[113] The Shapiro–Stiglitz model suggests that wages never bid down sufficiently to reach 0% unemployment.[114] That occurs because employers know that when wages decrease, workers will shirk and expend less effort. Employers avoid shirking by preventing wages from decreasing so low that workers give up and become unproductive. The higher wages perpetuate unemployment, but the threat of unemployment reduces shirking.
Before current levels of world trade were developed, unemployment was shown to reduce inflation, following the Phillips curve, or to decelerate inflation, following the NAIRU/natural rate of unemployment theory since it is relatively easy to seek a new job without losing a current job. When more jobs are available for fewer workers (lower unemployment), that may allow workers to find the jobs that better fit their tastes, talents and needs.
As in the Marxian theory of unemployment, special interests may also benefit. Some employers may expect that employees with no fear of losing their jobs will not work as hard or will demand increased wages and benefit. According to that theory, unemployment may promote general labour productivity and profitability by increasing employers’ rationale for their monopsony-like power (and profits).[27]
Optimal unemployment has also been defended as an environmental tool to brake the constantly-accelerated growth of the GDP to maintain levels that are sustainable in the context of resource constraints and environmental impacts.[115] However, the tool of denying jobs to willing workers seems a blunt instrument for conserving resources and the environment. It reduces the consumption of the unemployed across the board and only in the short term. Full employment of the unemployed workforce, all focused toward the goal of developing more environmentally-efficient methods for production and consumption, might provide a more significant and lasting cumulative environmental benefit and reduced resource consumption.[116]
Some critics of the «culture of work» such as the anarchist Bob Black see employment as culturally overemphasized in modern countries. Such critics often propose quitting jobs when possible, working less, reassessing the cost of living to that end, creation of jobs that are «fun» as opposed to «work,» and creating cultural norms in which work is seen as unhealthy. These people advocate an «anti-work» ethic for life.[117]
Decline in work hours[edit]
As a result of productivity, the work week declined considerably during the 19th century.[118][119] By the 1920s, the average workweek in the US was 49 hours, but it was reduced to 40 hours (after which overtime premium was applied) as part of the 1933 National Industrial Recovery Act. During the Great Depression, the enormous productivity gains caused by electrification, mass production, and agricultural mechanization were believed to have ended the need for a large number of previously-employed workers.[21][120]
Remedies[edit]
| 1936 | 1937 | 1938 | 1939 | 1940 | 1941 | |
|---|---|---|---|---|---|---|
| Workers employed | ||||||
| WPA | 1,995 | 2,227 | 1,932 | 2,911 | 1,971 | 1,638 |
| CCC and NYA | 712 | 801 | 643 | 793 | 877 | 919 |
| Other federal work projects | 554 | 663 | 452 | 488 | 468 | 681 |
| Cases on public assistance | ||||||
| Social security programs | 602 | 1,306 | 1,852 | 2,132 | 2,308 | 2,517 |
| General relief | 2,946 | 1,484 | 1,611 | 1,647 | 1,570 | 1,206 |
| Totals | ||||||
| Total families helped | 5,886 | 5,660 | 5,474 | 6,751 | 5,860 | 5,167 |
| Unemployed workers (BLS) | 9,030 | 7,700 | 10,390 | 9,480 | 8,120 | 5,560 |
| Coverage (cases/unemployed) | 65% | 74% | 53% | 71% | 72% | 93% |
Societies try a number of different measures to get as many people as possible into work, and various societies have experienced close to full employment for extended periods, particularly during the post-World War II economic expansion. The United Kingdom in the 1950s and 1960s averaged 1.6% unemployment,[122] and in Australia, the 1945 White Paper on Full Employment in Australia established a government policy of full employment, which lasted until the 1970s.[123]
However, mainstream economic discussions of full employment since the 1970s suggest that attempts to reduce the level of unemployment below the natural rate of unemployment will fail but result only in less output and more inflation.
Demand-side solutions[edit]
Increases in the demand for labour move the economy along the demand curve, increasing wages and employment. The demand for labour in an economy is derived from the demand for goods and services. As such, if the demand for goods and services in the economy increases, the demand for labour will increase, increasing employment and wages.
There are many ways to stimulate demand for goods and services. Increasing wages to the working class (those more likely to spend the increased funds on goods and services, rather than various types of savings or commodity purchases) is one theory that is proposed. Increased wages are believed to be more effective in boosting demand for goods and services than central banking strategies, which put the increased money supply mostly into the hands of wealthy persons and institutions. Monetarists suggest that increasing money supply in general increases short-term demand. As for the long-term demand, the increased demand is negated by inflation. A rise in fiscal expenditures is another strategy for boosting aggregate demand.
Providing aid to the unemployed is a strategy that is used to prevent cutbacks in consumption of goods and services, which can lead to a vicious cycle of further job losses and further decreases in consumption and demand. Many countries aid the unemployed through social welfare programs. Such unemployment benefits include unemployment insurance, unemployment compensation, welfare, and subsidies to aid in retraining. The main goal of such programs is to alleviate short-term hardships and, more importantly, to allow workers more time to search for a job.
A direct demand-side solution to unemployment is government-funded employment of the able-bodied poor. This was notably implemented in Britain from the 17th century until 1948 in the institution of the workhouse, which provided jobs for the unemployed with harsh conditions and poor wages to dissuade their use. A modern alternative is a job guarantee in which the government guarantees work at a living wage.
Temporary measures can include public works programs such as the Works Progress Administration. Government-funded employment is not widely advocated as a solution to unemployment except in times of crisis. That is attributed to the public sector jobs’ existence depending directly on the tax receipts from private sector employment.

Supply-side economics proposes that lower taxes lead to employment growth. Historical state data from the United States shows a heterogeneous result.
In the US, the unemployment insurance allowance is based solely on previous income (not time worked, family size, etc.) and usually compensates for one third of previous income. To qualify, people must reside in their respective state for at least a year and work. The system was established by the Social Security Act of 1935. Although 90% of citizens are covered by unemployment insurance, less than 40% apply for and receive benefits.[124] However, the number applying for and receiving benefits increases during recessions. For highly-seasonal industries, the system provides income to workers during the off-season, thus encouraging them to stay attached to the industry.

Tax decreases on high income earners (top 10%) are not correlated with employment growth, but tax decreases on lower-income earners (bottom 90%) are correlated with employment growth.[125]
According to classical economic theory, markets reach equilibrium where supply equals demand; everyone who wants to sell at the market price can do so. Those who do not want to sell at that price do not; in the labour market, this is classical unemployment. Monetary policy and fiscal policy can both be used to increase short-term growth in the economy, increasing the demand for labour and decreasing unemployment.
Supply-side solutions[edit]
However, the labor market is not 100% efficient although it may be more efficient than the bureaucracy. Some[who?] argue that minimum wages and union activity keep wages from falling, which means that too many people want to sell their labour at the going price but cannot. That assumes perfect competition exists in the labour market, specifically that no single entity is large enough to affect wage levels and that employees are similar in ability.
Advocates[who?] of supply-side policies believe those policies can solve the problem by making the labour market more flexible. These include removing the minimum wage and reducing the power of unions. Supply-siders argue that their reforms increase long-term growth by reducing labour costs. The increased supply of goods and services requires more workers, increasing employment. It is argued[by whom?] that supply-side policies, which include cutting taxes on businesses and reducing regulation, create jobs, reduce unemployment, and decrease labor’s share of national income. Other supply-side policies include education to make workers more attractive to employers.
History[edit]

There are relatively limited historical records on unemployment because it has not always been acknowledged or measured systematically. Industrialization involves economies of scale, which often prevent individuals from having the capital to create their own jobs to be self-employed. An individual who cannot join an enterprise or create a job is unemployed. As individual farmers, ranchers, spinners, doctors and merchants are organized into large enterprises, those who cannot join or compete become unemployed.
Recognition of unemployment occurred slowly as economies across the world industrialized and bureaucratized. Before that, traditional self-sufficient native societies had no concept of unemployment. The recognition of the concept of «unemployment» is best exemplified through the well documented historical records in England. For example, in 16th-century, England no distinction was made between vagrants and the jobless; both were simply categorized as «sturdy beggars», who were to be punished and moved on.[126]
16th century[edit]
The closing of the monasteries in the 1530s increased poverty, as the Roman Catholic Church had helped the poor. In addition, there was a significant rise in enclosures during the Tudor period. Also, the population was rising. Those unable to find work had a stark choice: starve or break the law. In 1535, a bill was drawn up calling for the creation of a system of public works to deal with the problem of unemployment, which were to be funded by a tax on income and capital. A law that was passed a year later allowed vagabonds to be whipped and hanged.[127]
In 1547, a bill was passed that subjected vagrants to some of the more extreme provisions of the criminal law: two years’ servitude and branding with a «V» as the penalty for the first offense and death for the second.[128] During the reign of Henry VIII, as many as 72,000 people are estimated to have been executed.[129] In the 1576 Act, each town was required to provide work for the unemployed.[130]
The Elizabethan Poor Law of 1601, one of the world’s first government-sponsored welfare programs, made a clear distinction between those who were unable to work and those able-bodied people who refused employment.[131] Under the Poor Law systems of England and Wales, Scotland and Ireland, a workhouse was a place people unable to support themselves could go to live and work.[132]
Industrial Revolution to late 19th century[edit]
Poverty was a highly visible problem in the eighteenth century, both in cities and in the countryside. In France and Britain by the end of the century, an estimated 10 percent of the people depended on charity or begging for their food.
By 1776, some 1,912 parish and corporation workhouses had been established in England and Wales and housed almost 100,000 paupers.
A description of the miserable living standards of the mill workers in England in 1844 was given by Fredrick Engels in The Condition of the Working Class in England in 1844.[133] In the preface to the 1892 edition, Engels noted that the extreme poverty he had written about in 1844 had largely disappeared. David Ames Wells also noted that living conditions in England had improved near the end of the 19th century and that unemployment was low.
The scarcity and the high price of labor in the US in the 19th century was well documented by contemporary accounts, as in the following:
«The laboring classes are comparatively few in number, but this is counterbalanced by, and indeed, may be one of the causes of the eagerness by which they call in the use of machinery in almost every department of industry. Wherever it can be applied as a substitute for manual labor, it is universally and willingly resorted to…. It is this condition of the labor market, and this eager resort to machinery wherever it can be applied, to which, under the guidance of superior education and intelligence, the remarkable prosperity of the United States is due.»[134]
Scarcity of labor was a factor in the economics of slavery in the United States.
As new territories were opened and federal land sales were conducted, land had to be cleared and new homesteads established. Hundreds of thousands of immigrants annually came to the US and found jobs digging canals and building railroads. Almost all work during most of the 19th century was done by hand or with horses, mules, or oxen since there was very little mechanization. The workweek during most of the 19th century was 60 hours. Unemployment at times was between one and two percent.
The tight labor market was a factor in productivity gains by allowing workers to maintain or to increase their nominal wages during the secular deflation that caused real wages to rise at various times in the 19th century, especially in its final decades.[135]
20th century[edit]

An unemployed German, 1928. Unemployment in Germany reached almost 30% of the workforce after the Great Depression.
There were labor shortages during World War I.[21] Ford Motor Co. doubled wages to reduce turnover. After 1925, unemployment gradually began to rise.[136]
The 1930s saw the Great Depression impact unemployment across the globe. In Germany and the United States, the unemployment rate reached about 25% in 1932.[137]
In some towns and cities in the northeast of England, unemployment reached as high as 70%; the national unemployment level peaked at more than 22% in 1932.[138] Unemployment in Canada reached 27% at the depth of the Depression in 1933.[139] In 1929, the U.S. unemployment rate averaged 3%.[140]

WPA poster promoting the benefits of employment
In the US, the Works Progress Administration (1935–43) was the largest make-work program. It hired men (and some women) off the relief roles («dole») typically for unskilled labor.[141]
During the New Deal, over three million unemployed young men were taken out of their homes and placed for six months into more than 2600 work camps managed by the Civilian Conservation Corps.[142]
Unemployment in the United Kingdom fell later in the 1930s as the Depression eased, and it remained low (in single figures) after World War II.
Fredrick Mills found that in the US, 51% of the decline in work hours was due to the fall in production and 49% was from increased productivity.[143]
By 1972, unemployment in the United Kingdom had crept back up above 1,000,000, and it was even higher by the end of the decade, with inflation also being high. Although the monetarist economic policies of Margaret Thatcher’s Conservative government saw inflation reduced after 1979, unemployment soared in the early 1980s and in 1982, it exceeded 3,000,000, a level that had not been seen for some 50 years. That represented one in eight of the workforce, with unemployment exceeding 20% in some places that had relied on declining industries such as coal mining.[144]
However, it was a time of high unemployment in all other major industrialised nations as well.[145] By the spring of 1983, unemployment had risen by 6% in the previous 12 months, compared to 10% in Japan, 23% in the US, and 34% in West Germany (seven years before Reunification).[146]
Unemployment in the United Kingdom remained above 3,000,000 until the spring of 1987, when the economy enjoyed a boom.[144] By the end of 1989, unemployment had fallen to 1,600,000. However, inflation had reached 7.8%, and the following year, it reached a nine-year high of 9.5%; leading to increased interest rates.[147]
Another recession occurred from 1990 to 1992. Unemployment began to increase, and by the end of 1992, nearly 3,000,000 in the United Kingdom were unemployed, a number that was soon lowered by a strong economic recovery.[144] With inflation down to 1.6% by 1993, unemployment then began to fall rapidly and stood at 1,800,000 by early 1997.[148]
21st century[edit]

Unemployment rate of Japan.[149] Red line is G7 average.
15-24 age (thin line) is youth unemployment.
The official unemployment rate in the 16 European Union (EU) countries that use the euro rose to 10% in December 2009 as a result of another recession.[150] Latvia had the highest unemployment rate in the EU, at 22.3% for November 2009.[151] Europe’s young workers have been especially hard hit.[152] In November 2009, the unemployment rate in the EU27 for those aged 15–24 was 18.3%. For those under 25, the unemployment rate in Spain was 43.8%.[153] Unemployment has risen in two thirds of European countries since 2010.[154]
Into the 21st century, unemployment in the United Kingdom remained low and the economy remaining strong, and several other European economies, such as France and Germany, experienced a minor recession and a substantial rise in unemployment.[155]
In 2008, when the recession brought on another increase in the United Kingdom, after 15 years of economic growth and no major rises in unemployment.[156] In early 2009, unemployment passed the 2 million mark, and economists were predicting it would soon reach 3 million.[157] However, the end of the recession was declared in January 2010[158] and unemployment peaked at nearly 2.7 million in 2011,[159] appearing to ease fears of unemployment reaching 3 million.[160] The unemployment rate of Britain’s young black people was 47.4% in 2011.[161] 2013/2014 has seen the employment rate increase from 1,935,836 to 2,173,012 as supported by[162] showing the UK is creating more job opportunities and forecasts the rate of increase in 2014/2015 will be another 7.2%.[163]
The 2008–2012 global recession has been called a «mancession» because of the disproportionate number of men who lost their jobs as compared to women. The gender gap became wide in the United States in 2009, when 10.5% of men in the labor force were unemployed, compared with 8% of women.[164][165] Three quarters of the jobs that were lost in the recession in the US were held by men.[166][167]
A 26 April 2005 Asia Times article noted, «In regional giant South Africa, some 300,000 textile workers have lost their jobs in the past two years due to the influx of Chinese goods».[168] The increasing US trade deficit with China cost 2.4 million American jobs between 2001–2008, according to a study by the Economic Policy Institute (EPI).[169] From 2000–2007, the United States lost a total of 3.2 million manufacturing jobs.[170] 12.1% of US military veterans who had served after the September 11 attacks in 2001 were unemployed as of 2011; 29.1% of male veterans aged 18–24 were unemployed.[84] As of September 2016, the total veteran unemployment rate was 4.3 percent. By September 2017, that figure had dropped to 3 percent.[171]
About 25,000,000 people in the world’s 30 richest countries lost their jobs between the end of 2007 and the end of 2010, as the economic downturn pushed most countries into recession.[172] In April 2010, the US unemployment rate was 9.9%, but the government’s broader U-6 unemployment rate was 17.1%.[173] In April 2012, the unemployment rate was 4.6% in Japan.[174] In a 2012 story, the Financial Post reported, «Nearly 75 million youth are unemployed around the world, an increase of more than 4 million since 2007. In the European Union, where a debt crisis followed the financial crisis, the youth unemployment rate rose to 18% last year from 12.5% in 2007, the ILO report shows.»[175] In March 2018, according to US Unemployment Rate Statistics, the unemployment rate was 4.1%, below the 4.5–5.0% norm.[176]
See also[edit]
- Universal basic income
- Career and Life Planning Education
- Critique of work
- Economics terminology that differs from common usage
- Effective unemployment rate
- Employment protection legislation
- Employment-to-population ratio
- Federal Reserve Economic Data (FRED)
- Graduate unemployment
- Green growth
- HIRE Act
- Job migration
- Jobseeker’s Allowance
- List of countries by long-term unemployment rate
- List of countries by unemployment rate
- List of films featuring unemployment
- List of U.S. states by unemployment rate
- List of European regions by unemployment rate
- Practice firm
- Refusal of work
- Salary inversion
- Short-time working
- Spatial mismatch
- Technological unemployment
- Unemployment extension
- Waithood
- Workfare
- Youth exclusion
Notes[edit]
- ^ «Unemployment rate». Our World in Data. Retrieved 7 March 2020.
- ^ «OECD Data:Employment rate by age group».
- ^ «OECD Statistical Glossary: UNEMPLOYED».
- ^ «OECD Statistical Glossary: UNEMPLOYMENT RATE (HARMONISED)».
- ^ «International Labour Organization: Unemployment rate».
- ^ «OECD TAX IDENTIFICATION NUMBERS».
- ^ Hayek, F. A. (1960). The Constitution of Country. Chicago: University of Chicago Press.
- ^ a b c Anderton, Alain (2006). Economics (Fourth ed.). Ormskirk: Causeway. ISBN 978-1-902796-92-5.
- ^ Garegnani, P. (1970). «Heterogeneous Capital, the Production Function and the Theory of Distribution». Review of Economic Studies. 37 (3): 407–436. doi:10.2307/2296729. JSTOR 2296729.
- ^ Vienneau, Robert L. (2005). «On Labour Demand and Equilibria of the Firm». The Manchester School. 73 (5): 612–619. doi:10.1111/j.1467-9957.2005.00467.x. S2CID 153778021.
- ^ Opocher, Arrigo; Steedman, Ian (2009). «Input Price-Input Quantity Relations and the Numéraire». Cambridge Journal of Economics. 3 (5): 937–948. doi:10.1093/cje/bep005.
- ^ Anyadike-Danes, Michael; Godley, Wyne (1989). «Real Wages and Employment: A Skeptical View of Some Recent Empirical Work». The Manchester School. 62 (2): 172–187. doi:10.1111/j.1467-9957.1989.tb00809.x.
- ^ White, Graham (2001). «The Poverty of Conventional Economic Wisdom and the Search for Alternative Economic and Social Policies». The Drawing Board: An Australian Review of Public Affairs. 2 (2): 67–87.
- ^ Rothbard, Murray (1963). America’s Great Depression. Princeton: Van Nostrand. p. 45.
- ^ Vedder, Richard; Gallaway, Lowell (1997). Out of Work: Unemployment and Government in the Twentieth-Century America. New York: NYU Press. ISBN 978-0-8147-8792-2.
- ^ a b Keynes, John Maynard (2007) [1936]. The General Theory of Employment, Interest and Money. Basingstoke, Hampshire: Palgrave Macmillan. ISBN 978-0-230-00476-4. Archived from the original on 16 March 2009.
- ^
Harris, Seymour E. (2005). The New Economics: Keynes’ Influence on Theory and Public Policy. Kessinger Publishing. ISBN 978-1-4191-4534-6. - ^ a b c d Chang, R. (1997) «Is Low Unemployment Inflationary?» Archived 13 November 2013 at the Wayback Machine Federal Reserve Bank of Atlanta Economic Review 1Q97:4–13
- ^ a b c Oliver Hossfeld (2010) «US Money Demand, Monetary Overhang, and Inflation Prediction» International Network for Economic Research working paper no. 2010.4
- ^ «MZM velocity». Research.stlouisfed.org. 20 December 2012. Retrieved 1 March 2014.
- ^ a b c Jerome, Harry (1934). Mechanization in Industry, National Bureau of Economic Research.
- ^ Komlos, John (2019). The Real U.S. Unemployment Rate Is Twice the Official Rate, and the Phillips Curve (PDF). CesIfo working paper No 7859. pp. 54–74.
- ^ Bivens, Josh; Shierholz, Heidi, Lagging Demand, Not Unemployability, Is Why Long-term Unemployment Remains So High, Economic Policy Institute
- ^ «COUNCIL RECOMMENDATION of 15 February 2016 on the integration of the long-term unemployed into the labour market». Official Journal of the European Union. 20 February 2016. 2016/C 67/01.
- ^ «LTU project — Long Term Unemployment project — EUROPEAN SOCIAL FUND — European Commission». EUROPEAN SOCIAL FUND. Retrieved 11 March 2021.
- ^ «Commission publishes report on reintegration of long-term unemployed». ec.europa.eu. Retrieved 11 March 2021.
- ^ a b Marx, Karl (1863). Theorien über den Mehrwert (Theory of Surplus Value). pp. 478 or at MEW, 26.3, 300.
- ^ «Marx and Keynes on Unemployment». Archived from the original on 15 June 2018. Retrieved 15 June 2018.
- ^ Marx, Karl (2009). Capital: An Abridged Edition. Edited by David McLellan, Oxford Paperbacks, Oxford, UK. ISBN 978-0-19-953570-5.
- ^ «Communist Manifesto (Chapter 1)».
- ^ «Glossary of Terms: Al».
- ^ Marx, Karl. «The Communist Manifesto». Retrieved 22 October 2010.
- ^ «International Unemployment Rates: How Comparable are They?» by Constance Sorrentino, Monthly Labor Review, June 2000, pp. 3–20.
- ^ a b International Labour Organization Bureau of Statistics Measurement of employment, unemployment and underemployment – Current international standards and issues in their application. Retrieved August 2010 Archived 24 September 2011 at the Wayback Machine
- ^ International Labour Organization, Bureau of Statistics,The Thirteenth International Conference of Labour Statisticians, received 21 July 2007
- ^ a b Zuckerman, Sam (17 November 2002). «Official unemployment numbers omit discouraged seekers, part-time workers». San Francisco Chronicle. Archived from the original on 29 June 2011. Retrieved 27 July 2011.
- ^ Coy, P. (11 September 2012). U.S. jobless rate drops for the worst of all reasons. Businessweek.Com, 5.
- ^ «Glossary:Unemployment». Eurostat.
- ^ «Glossary:Labour force». Eurostat.
- ^ «Unemployment rate». Organization for Economic Cooperation and Development (OECD).
- ^ «Employment, Social Affairs & Inclusion». European Commission.
- ^ «Unemployment Help». United States government website.
- ^ «Arbeitslosenquote». Statistisches Bundesamt.
- ^ «Labor Force Statistics from the Current Population Survey». Bureau of Labor Statistics.
- ^ «Glossary:Labour force survey (LFS)». Eurostat.
- ^ International Labour Organization, LABORSTA,[1] Archived 7 July 2007 at the Wayback Machine. Retrieved 22 July 2007.
- ^ Schmitt, John; Rho, Hye Jin; Fremstad, Shawn. U.S. Unemployment Now As High as Europe. Center for Economic and Policy Research. May 2009.
- ^ «Resolution I Resolution concerning statistics of work, employment and labour underutilization» (PDF). ILO.
- ^ Marco Giugni, ed. The Contentious Politics of Unemployment in Europe: Welfare States and Political Opportunities(Palgrave Macmillan; 2011) covers Britain, France, Germany, Italy, Sweden, and Switzerland.
- ^ «European Commission, Eurostat». Archived from the original on 26 November 2009. Retrieved 5 November 2009.
- ^ Bureau of Labor Statistics (2009). «Labor force data by county, 2008 annual averages».[permanent dead link]
- ^ United States, Bureau of Labor Statistics,[2]. Retrieved 23 July 2007.
- ^ U.S. Department of Labor, Bureau of Labor Statistics, Current Population Survey overview. Retrieved 25 May 2007.
- ^ a b U.S. Department of Labor, Bureau of Labor Statistics, «The Employment Situation: January 2008,» January 2008
- ^ U.S. Department of Labor, Employment & Training Administration, Office of Workforce Security, UI Weekly Claims
- ^ «The Employment Situation: February 2010» (PDF). Retrieved 16 December 2010.
- ^ «Employment Situation Summary». Bureau of Labor Statistics. 8 July 2011. Retrieved 27 July 2011.
- ^ U.S. Department of Labor, Bureau of Labor Statistics, Table A-15. Alternative measures of labour underutilization Retrieved 5 August 2010.
- ^ «Labor Force Statistics (CPS), Alternative Measures U-1 through U-6». Bureau of Labor Statistics. 6 January 2012. Retrieved 6 January 2012.
- ^ International Labor Organization (October 1982). «Resolution concerning statistics of the economically active population, employment, unemployment, and underemployment, adopted by the Thirteenth International Conference of Labor Statisticians; see page 4» (PDF). Retrieved 26 November 2007.
- ^ Bregger, John E.; Haugen, Steven E. (1995). «BLS introduces new range of alternative unemployment measures» (PDF). Monthly Labor Review, October: 19–29. U.S. Department of Labor, Bureau of Labor Statistics. Retrieved 6 March 2009.
- ^ Honathan Horn (24 April 2013). «Rep. Hunter Seeks to Change Jobless Reporting Method». San Diego Union Tribune. Archived from the original on 3 December 2013. Retrieved 23 June 2013.
Molly K. Hooper (8 April 2012). «GOP lawmaker calls for change to how government measures unemployment». The Hill. Archived from the original on 24 June 2013. Retrieved 23 June 2013.
Matt Nesto (2 August 2012). «The Unemployment Rate Is a Farce That Needs Fixing: Rep. Duncan Hunter». Yahoo! Finance. Retrieved 23 June 2013. - ^ «The Punishing Decade: Prison and Jail Estimates at the Millennium» (PDF). Justice Policy Institute. May 2000.
- ^ Western, Bruce; Beckett, Katherine (1999). «How Unregulated Is the U.S. Labor Market? The Penal System as a Labor Market Institution». American Journal of Sociology. 104 (4): 1030–1060. doi:10.1086/210135. S2CID 27785866.
- ^ a b c d Lebergott, Stanley (1964). Manpower in Economic Growth: The American Record since 1800. New York: McGraw-Hill. pp. 164–190.
- ^ Romer, Christina (1986). «Spurious Volatility in Historical Unemployment Data». Journal of Political Economy. 94 (1): 1–37. doi:10.1086/261361. JSTOR 1831958. S2CID 15302777.
- ^ Coen, Robert M. (1973). «Labor Force and Unemployment in the 1920s and 1930s: A Re-Examination Based on Postwar Experience». Review of Economics and Statistics. 55 (1): 46–55. doi:10.2307/1927993. JSTOR 1927993.
- ^ Bureau of Labor Statistics. «Employment status of the civilian noninstitutional population, 1940 to date». Retrieved 6 March 2009.[permanent dead link]
- ^ «Historical Comparability» (PDF). Employment and Earnings. Household Data Explanatory Notes, February 2006. 2006.
- ^ a b c Krueger, Alan B.; Lawrence F. Katz (1999). «New Trend in Unemployment?: The High-Pressure U.S. Labor Market of the 1990s». Brookings Review. Archived from the original on 11 May 2011. Retrieved 18 February 2011.
- ^ «Reporting benefit fraud». Directgov. Retrieved 27 July 2011.
- ^ Baker, Dean. «Wall Street Journal Gets German Unemployment Wrong». The American Prospect. Archived from the original on 30 September 2007. Retrieved 1 June 2007.
- ^ Raymond Torres, OECD head of Employment Analysis, Avec 1,2 % de baisse fin avril, le taux de chômage continue sa décrue[permanent dead link] Le Monde, 30 mai 2007 : unemployment measure is less and less meaningful to measure labour market efficiency.
- ^ «Determination of the December 2007 Peak in Economic Activity». The National Bureau of Economic Research. 28 November 2008. Archived from the original on 5 September 2013. Retrieved 27 July 2011.
- ^ a b Civilian Labor Force Participation Rate: Women Federal Reserve Bank of St. Louis
- ^ Van Zandweghe, Willem. «Interpreting the Recent Decline in Labor Force Participation» (PDF). KC Fed Economic Review, First Quarter, 2012: 5–34. Archived from the original (PDF) on 15 January 2013. Retrieved 22 April 2013.
- ^ Peter Barth and Dennis Heffley «Taking Apart Taking Part: Local Labor Force Participation Rates» University of Connecticut, 2004.
- ^ «Unemployment statistics — Statistics Explained». Epp.eurostat.ec.europa.eu. Retrieved 1 March 2014.
- ^ «File:Youth unemployment, 2012Q4 (%).png — Statistics Explained». Epp.eurostat.ec.europa.eu. Retrieved 1 March 2014.
- ^ Castells-Quintana, David; Vicente Royuela (2012). «Unemployment and long-run economic growth: The role of income inequality and urbanisation» (PDF). Investigaciones Regionales. 12 (24): 153–173. hdl:10017/27066. Retrieved 17 October 2013.
- ^ Christoffersen, John (14 October 2013). «Rising inequality ‘most important problem,’ says Nobel-winning economist». St. Louis Post-Dispatch. Retrieved 19 October 2013.
- ^ «Suburban Homeless: Rising Tide of Families». CBS News. 16 February 2010. Archived from the original on 19 February 2010. Retrieved 30 May 2010.
- ^ Burkeman, Oliver (26 March 2009). «U.S. tent cities highlight new realities as recession wears on». The Guardian. London.
- ^ a b Meade, Barbara J.; Glenn, Margaret K.; Wirth, Oliver (29 March 2013). «Mission Critical: Getting Vets With PTSD Back to Work». NIOSH: Workplace Safety and Health. Medscape & NIOSH.
- ^ «Even Optimists Get the Blues When Pink-slipped». Newswise. Retrieved 27 October 2008.
- ^ Brenner, M. Harvey (1979). «Influence of the Social Environment on Psychology: The Historical Perspective». In Barrett, James E. (ed.). Stress and Mental Disorder. New York: Raven Press. ISBN 978-0-89004-384-4.
- ^ Richard Ashley (2007). «Fact sheet on the impact of unemployment» (PDF). Virginia Tech, Department of Economics. Archived from the original (PDF) on 25 October 2007. Retrieved 11 October 2007.
- ^ Ruhm, Christopher (2000). «Are Recessions Good for Your Health?» (PDF). Quarterly Journal of Economics. 115 (2): 617–650. doi:10.1162/003355300554872. S2CID 51729569.
- ^ Boyce, Christopher J.; Wood, Alex M.; Brown, Gordon D.A. (2010). «The dark side of conscientiousness: Conscientious people experience greater drops in life satisfaction following unemployment». Journal of Research in Personality. 44 (4): 535–539. doi:10.1016/j.jrp.2010.05.001.
- ^ Bockerman, Petri; Ilmakunnas, Pekka (2009). «Unemployment and self-assessed health: evidence from panel data» (PDF). Health Economics. 18 (2): 161–179. CiteSeerX 10.1.1.719.5903. doi:10.1002/hec.1361. PMID 18536002.
- ^ Blustein, David L.; Kozan, Saliha; Connors-Kellgren, Alice (2013). «Unemployment and underemployment: A narrative analysis about loss». Journal of Vocational Behavior. 82 (3): 256–265. doi:10.1016/j.jvb.2013.02.005.
- ^ Covizzi, Ilaria (1 July 2008). «Does Union Dissolution Lead to Unemployment? A Longitudinal Study of Health and Risk of Unemployment for Women and Men Undergoing Separation». European Sociological Review. 24 (3): 347–361. doi:10.1093/esr/jcn006. ISSN 0266-7215.
- ^ Amato, Paul R.; Beattie, Brett (1 May 2011). «Does the unemployment rate affect the divorce rate? An analysis of state data 1960–2005». Social Science Research. 40 (3): 705–715. doi:10.1016/j.ssresearch.2010.12.012.
- ^ Meer, Peter H. van der (21 November 2012). «Gender, Unemployment and Subjective Well-Being: Why Being Unemployed Is Worse for Men than for Women». Social Indicators Research. 115 (1): 23–44. doi:10.1007/s11205-012-0207-5. ISSN 0303-8300. S2CID 145056657.
- ^ a b Fang, Tony; MacPhail, Fiona (27 November 2007). «Transitions from Temporary to Permanent Work in Canada: Who Makes the Transition and Why?». Social Indicators Research. 88 (1): 51–74. doi:10.1007/s11205-007-9210-7. hdl:10315/6293. ISSN 0303-8300. S2CID 154555810.
- ^ Michniewicz, Kenneth S.; Vandello, Joseph A.; Bosson, Jennifer K. (19 January 2014). «Men’s (Mis)Perceptions of the Gender Threatening Consequences of Unemployment». Sex Roles. 70 (3–4): 88–97. doi:10.1007/s11199-013-0339-3. ISSN 0360-0025. S2CID 144321429.
- ^ Facing the Challenge: The Impact of Recession and Unemployment on Men’s Health in Ireland (PDF), Institute of Public Health in Ireland, June 2011
- ^ Social isolation a key risk factor for suicide among Australian men – study. The Guardian. Author — Melissa Davey. Published 25 June 2015. Retrieved 9 August 2018.
- ^ Li, Ang; Toll, Mathew (2021). «Effects of graduating during economic downturns on mental health». Annals of Epidemiology. 55 (55): 41–49. doi:10.1016/j.annepidem.2020.12.005. ISSN 1047-2797. PMID 33359536. S2CID 229693054.
- ^ a b Kaberi Gayen; Ronald McQuaid; Robert Raeside (22 June 2010). «Social networks, age cohorts and employment». International Journal of Sociology and Social Policy. 30 (5/6): 219–238. doi:10.1108/01443331011054208. ISSN 0144-333X.
- ^ Jacob, Marita; Kleinert, Corinna (1 April 2008). «Does Unemployment Help or Hinder Becoming Independent? The Role of Employment Status for Leaving the Parental Home». European Sociological Review. 24 (2): 141–153. doi:10.1093/esr/jcm038. hdl:10419/31878. ISSN 0266-7215.
- ^ Wray-Lake, Laura; Syvertsen, Amy K.; Briddell, Laine; Osgood, D. Wayne; Flanagan, Constance A. (1 September 2011). «Exploring the Changing Meaning of Work for American High School Seniors From 1976 to 2005». Youth & Society. 43 (3): 1110–1135. doi:10.1177/0044118X10381367. ISSN 0044-118X. PMC 3199574. PMID 22034546.
- ^ McVittie, Chris; McKinlay, Andy; Widdicombe, Sue (2008). «Passive and active non-employment: Age, employment and the identities of older non-working people». Journal of Aging Studies. 22 (3): 248–255. doi:10.1016/j.jaging.2007.04.003.
- ^ «Price Theory: First Edition, Chapter 22: Inflation and Unemployment». Daviddfriedman.com. Retrieved 27 July 2011.
- ^ Steininger, M.; Rotte, R. (2009). «Crime, unemployment, and xenophobia?: An ecological analysis of right-wing election results in Hamburg, 1986–2005». Jahrbuch für Regionalwissenschaft. 29 (1): 29–63. doi:10.1007/s10037-008-0032-0. S2CID 161133018.
- ^ Sarah Boseley (11 February 2015). Unemployment causes 45,000 suicides a year worldwide, finds study. The Guardian. Retrieved 13 February 2015.
- ^ Sulich, Adam (2016). «The young people’s labour market and crisis of integration in European Union». International Conference on European Integration. 2: 926–934.
- ^ Why are We Afraid to Create the Jobs We Need?, Les Leopold, 5 March 2010
- ^ «Whatever happened to full employment?». BBC News. 13 October 2011.
- ^ Natale, Samuel; Rothschild, Brian (1995). Work Values: Education, Organization and Religious Concerns (Value Inquiry Book Series , No 28). Brill Rodopi. pp. 91–100.
- ^ He, Xiaohong (1998). «From Trade Among Nations to Trade Within Firms Across National Borders». In Mucchielli, Jean Louis; Buckley, Peter J.; Cordell, Victor V. (eds.). Globalization and Regionalization: Strategies, Policies, and Economic Environments. Binghamton, NY: International Business Press. pp. 15–73. ISBN 978-0-7890-0513-7.
- ^ «What full employment really means». The Economist. 2017.[permanent dead link]
- ^ Shapiro, Carl; Stiglitz, Joseph E. (1984). «Equilibrium Unemployment as a Worker Discipline Device». American Economic Review. 74 (3): 433–444. JSTOR 1804018.
- ^ «Efficiency wages, the Shapiro-Stiglitz Model» (PDF). Archived from the original (PDF) on 15 July 2011. Retrieved 27 July 2011.
- ^ O’Sullivan, Arthur; Sheffrin, Steven M. (2003). Economics: Principles in Action. Upper Saddle River, NJ: Pearson Prentice Hall. p. 335. ISBN 978-0-13-063085-8.
- ^ Richard, Michael Graham (2 June 2008). «Counter-Point: 4 Reasons Why Recession is BAD for the Environment». TreeHugger. Archived from the original on 9 February 2008. Retrieved 11 February 2008.
- ^ «The Idle Foundation». Archived from the original on 9 July 2012. Retrieved 26 August 2018.
- ^ «Hours of Work in U.S. History». 2010. Archived from the original on 26 October 2011.
- ^ Whaples, Robert (1991). «The Shortening of the American Work Week: An Economic and Historical Analysis of Its Context, Causes, and Consequences». Journal of Economic History. 51 (2): 454–457. doi:10.1017/s0022050700039073. JSTOR 2122588. S2CID 153813437.
- ^ Bell, Spurgeon (1940). Productivity, Wages and National Income, The Institute of Economics of the Brookings Institution.
- ^ Howard, Donald S. (1943). WPA and Federal Relief Policy. p. 34.
- ^ Sloman, John (2003). Economics. London: Prentice Hall. p. 811. ISBN 978-0-273-65574-9.
- ^ Badham, Van (26 July 2019). «Having a constant pool of unemployed workers is deliberate policy | Van Badham». The Guardian. ISSN 0261-3077. Retrieved 24 October 2019.
- ^ «Introduction to Unemployment Insurance». Center on Budget and Policy Priorities. 15 December 2008. Retrieved 21 October 2010.
- ^ «Tax Cuts for Job Creators». The New York Times. 19 October 2012.
- ^ «Sturdy Beggars». Probertencyclopaedia.com. Archived from the original on 8 June 2011. Retrieved 22 July 2009.
- ^ «Poor Tudors». Localhistories.org. Retrieved 22 July 2009.
- ^ R. O. Bucholz, Newton Key, Early modern England, 1485–1714, p176
- ^ «History of the Death Penalty». Public Broadcasting Service (PBS).
- ^ «Poverty in Elizabethan England». BBC – History.
- ^ «Social Classes in Shakespeare’s England» Archived 16 March 2010 at the Wayback Machine
- ^ «British social policy, 1601–1948 Archived 30 June 2007 at the Wayback Machine», The Robert Gordon University, Aberdeen.
- ^ Engels, Fredrick (1892). The Condition of the Working-Class in England in 1844. London: Swan Sonnenschein & Co. pp. 45, 48–53.Link is to excerpt
- ^ Roe, Joseph Wickham (1916), English and American Tool Builders, New Haven, Connecticut: Yale University Press, LCCN 16011753. Reprinted by McGraw-Hill, New York and London, 1926 (LCCN 27-24075); and by Lindsay Publications, Inc., Bradley, Illinois, (ISBN 978-0-917914-73-7). Report of the British Commissioners to the New York Industrial Exhibition, London 1854
- ^ Wells, David A. (1891). Recent Economic Changes and Their Effect on Production and Distribution of Wealth and Well-Being of Society. New York: D. Appleton and Co. ISBN 978-0-543-72474-8.
RECENT ECONOMIC CHANGES AND THEIR EFFECT ON DISTRIBUTION OF WEALTH AND WELL BEING OF SOCIETY WELLS.
- ^ Beaudreau, Bernard C. (1996). Mass Production, the Stock Market Crash and the Great Depression. New York, Lincoln, Shanghi: Authors Choice Press.
- ^ About the Great Depression, University of Illinois
- ^ «Social conditions in Britain in the 1930s: employment and unemployment». Blacksacademy.net. Archived from the original on 10 September 2011. Retrieved 27 July 2011.
- ^ 1929–1939 – The Great Depression Archived 27 January 2009 at the Wayback Machine, Source: Bank of Canada
- ^ Economic Recovery in the Great Depression, Frank G. Steindl, Oklahoma State University Archived 28 September 2013 at the Wayback Machine
- ^ Nancy E. Rose, Put to Work: The WPA and Public Employment in the Great Depression (2nd ed. 2009)
- ^ Finegan, Chance (11 September 2008). «National Park History: «The Spirit of the Civilian Conservation Corps»«. National Parks Traveler. Archived from the original on 5 September 2010. Retrieved 27 July 2011.
- ^ Rifkin, Jeremy (1995). The End of Work: The Decline of the Global Labor Force and the Dawn of the Post-Market Era. Putnam Publishing Group. ISBN 978-0-87477-779-6.
- ^ a b c «Unemployment, issue briefing». Politics.co.uk. Archived from the original on 9 June 2011. Retrieved 27 July 2011.
- ^ Phelps, Edmund S.; Zoega, Gylfi (2002). «The Incidence of Increased Unemployment in the Group of Seven, 1970–94». In Bitros, George; Katsoulacos, Yannis (eds.). Essays in Economic Theory, Growth and Labor Markets. Cheltenham: Edward Elgar. pp. 177–210. ISBN 978-1-84064-739-6.
- ^ «CPA Poster Collection». Conservative Party Archive Poster Collection. Archived from the original on 12 August 2011. Retrieved 17 October 2018.
- ^ «Historical UK Inflation And Price Conversion». Safalra’s Website. 15 April 2010. Retrieved 27 July 2011.
- ^ «Jobless Rate in Britain Drops to Six-Year Low». The New York Times. 16 January 1997. Retrieved 27 July 2011.
- ^ OECD Labour Force Statistics 2020, OECD Labour Force Statistics, OECD, 2020, doi:10.1787/23083387, ISBN 9789264687714
- ^ «Euro-zone unemployment climbs to 10 percent high. Deutsche Welle. 29 January 2010.
- ^ «Eurozone unemployment hits double digits». UPI.com. 8 January 2010.
- ^ «Europe’s New Lost Generation». Foreign Policy. 13 July 2009.
- ^ November 2009 Euro area unemployment rate up to 10.0% EU27 up to 9.5% . Eurostat. 8 January 2010.
- ^ «Global unemployment outlook gloomy, warns ILO. The Guardian. 30 April 2012.
- ^ «Germany’s recession ends». BBC News. 23 May 2002. Retrieved 27 July 2011.
- ^ «Jobless rise highest for 17 years». BBC News. 15 October 2008. Retrieved 27 July 2011.
- ^ «Unemployment passes two million». BBC News. 18 March 2009. Retrieved 27 July 2011.
- ^ «UK economy emerges from recession». BBC News. 27 January 2010. Retrieved 27 July 2011.
- ^ «UK youth unemployment at its highest in two decades: 22.5%». MercoPress. 15 April 2012.
- ^ «UK unemployment increases to 2.5 million». BBC News. 21 April 2010. Retrieved 27 July 2011.
- ^ Ball, James; Milmo, Dan; Ferguson, Ben (9 March 2012). «Half of UK’s young black males are unemployed». The Guardian. London.
- ^ http://www.ons.gov.uk/ons/publications/2014_2015re-reference-tables.html?edition=tcm%3A77-226710[dead link]
- ^ «Data». ons.gov.uk. ONS.
- ^ Baxter, Sarah (7 June 2009), «Women are victors in ‘mancession‘«, The Sunday Times, London, retrieved 12 May 2010
- ^ Howard J. Wall (October 2009), The ‘Man-Cession’ of 2008-2009, Federal Reserve Bank of St Louis, archived from the original on 29 August 2014, retrieved 26 March 2020
- ^ Daum, Meghan (20 October 2011), «Inside the mating economy», Los Angeles Times
- ^ Vanderkam, Laura (4 March 2012), The Princess Problem, originally ran in USA Today on 12 August 2009
- ^ «Asia strips Africa’s textile industry». Asia Times. 26 April 2005.
- ^ «China trade blamed for 2.4 million lost US jobs-report». Reuters. 23 March 2010.
- ^ «Factory jobs: 3 million lost since 2000». USA Today. 20 April 2007.
- ^ Riley, Kim (11 October 2017). «Utilities open employment arms to U.S. military veterans». Daily Energy Insider. Retrieved 23 October 2017.
- ^ «Unemployment hits highest since 1995». 16 September 2009.
- ^ «Broader U-6 Unemployment Rate Increases to 17.1% in April». The Wall Street Journal. 7 May 2010.
- ^ Unemployment statistics. Eurostat. April 2012.
- ^ «Global youth unemployment rate climbs». Financial Post. Business.financialpost.com. 23 May 2012. Retrieved 1 March 2014.
- ^ AMADEO, KIMBERLY (April 2018). «Current U.S. Unemployment Rate Statistics and News». The Balance.
References[edit]
- Farmer, Roger E. A. (2001). «Unemployment». Macroeconomics (Second ed.). Cincinnati: South-Western Publishing. pp. 173–192. ISBN 978-0-324-14964-7.
- Kalecki, Michał (1943). «Political aspects of full employment» (PDF). The Political Quarterly. 14 (4): 322–331. doi:10.1111/j.1467-923X.1943.tb01016.x.
- McGaughey, Ewan (September 2022). «Will Robots Automate Your Job Away? Full Employment, Basic Income, and Economic Democracy». (2022) 51(3) Industrial Law Journal 511–559. doi:10.2139/ssrn.3044448. S2CID 219336439. SSRN 3044448.
- Reich, Robert B. (2010). Aftershock: The Next Economy and America’s Future (1st ed.). Alfred A. Knopf. ISBN 978-0-307-59281-1.
- Romer, David (2011). «Unemployment». Advanced Macroeconomics (Fourth ed.). New York: McGraw-Hill Education. pp. 456–512. ISBN 978-0-07-351137-5.
- Simonazzi, Annamaria; Vianello, Fernando (2001). «Financial Liberalization, the European Single Currency and the Problem of Unemployment». In Franzini, M.; Pizzuti, F. R. (eds.). Globalization, Institutions and Social Cohesion. Heidelberg: Springer. ISBN 978-3-540-67741-3.
Historical: Europe and Japan[edit]
- Beveridge, William H. (1944). Full Employment in a Free Society (1st ed.). Allen & Unwin., in Great Britain.
- Broadberry, Stephen N., and Albrecht Ritschl. «Real Wages, Productivity, and Unemployment in Britain and Germany during the 1920s.» Explorations in Economic History 32.3 (1995): 327-349.
- Dimsdale, Nicholas H., Nicholas Horsewood, and Arthur Van Riel. «Unemployment in interwar Germany: an analysis of the labor market, 1927-1936.» Journal of Economic History (2006): 778-808. online
- Heimberger, Philipp, Jakob Kapeller, and Bernhard Schütz. «The NAIRU determinants: What’s structural about unemployment in Europe?.» Journal of Policy Modeling 39.5 (2017): 883-908. online
- Kato, Michiya. «Unemployment and Public Works Policy in Interwar Britain and Japan: An International Comparison.» (2010): 69-101. online
- Kaufman, Roger T. «Patterns of Unemployment in North America, Western Europe and Japan.» Unemployment in Western countries (Palgrave Macmillan, 1980). 3-35.
- Nickell, Stephen, Luca Nunziata, and Wolfgang Ochel. «Unemployment in the OECD since the 1960s. What do we know?.» Economic Journal 115.500 (2005): 1-27 online.
- Stachura, Peter D., ed. Unemployment and the great depression in Weimar Germany (Springer, 1986).
- Topp, Niels-Henrik. «Unemployment and Economic Policy in Denmark in the 1930s.» Scandinavian Economic History Review 56.1 (2008): 71-90.
- Webb, Sidney (1912). How the Government Can Prevent Unemployment. The National Committee for the Prevention of Destitution. (First ed.). Letchworth, Herts.: Garden City Press Ltd., in Great Britain
Historical: United States[edit]
- Jensen, Richard J. «The causes and cures of unemployment in the Great Depression.» Journal of Interdisciplinary History 19.4 (1989): 553-583 online.
- Keyssar, Alexander (1986). Out of Work: The First Century of Unemployment in Massachusetts. Cambridge University Press. ISBN 978-0-521-23016-2.
- Margo, Robert A. «Employment and Unemployment in the 1930s.» Journal of Economic Perspectives 7.2 (1993): 41-59. online
- Stricker, Frank. American Unemployment: Past, Present, and Future (University of Illinois Press, 2020) online review
- Sundstrom, William A. «Last hired, first fired? Unemployment and urban black workers during the Great Depression.» Journal of Economic History (1992): 415-429. online
- Temin, Peter. «Socialism and Wages in the Recovery from the Great Depression in the United States and Germany.» Journal of Economic History (1990): 297-307 online.
External links[edit]
![]() Quotations related to unemployment at Wikiquote
Quotations related to unemployment at Wikiquote
![]() The dictionary definition of unemployment at Wiktionary
The dictionary definition of unemployment at Wiktionary
 Media related to Unemployment at Wikimedia Commons
- Economic Policy Institute
- Current unemployment figures, CEIC Data
- Current unemployment rates by country
- OECD Unemployment statistics
- Unemployment statistics by Lebanese-economy-forum, World Bank data
- JobCity is Right Platform for Govt Jobs
- Thermal maps of the world’s unemployment percentage rates – by country, 2007–2010
Что такое Фрикционная безработица?
Фрикционная безработица – это вид краткосрочной безработицы. Фрикционная безработица возникает, когда человек добровольно ищет работу или ищет новую должность. Фрикционная безработица возникает естественным образом даже в растущей, стабильной экономике.
В экономике всегда присутствует фрикционная безработица. Он вносит вклад в общую картину занятости и является частью естественной безработицы, которая представляет собой минимальный уровень безработицы в экономике, обусловленный экономическими силами и перемещением рабочей силы. Естественная безработица также отражает количество работников, которые не имеют работы по собственному желанию, либо из-за нехватки навыков, либо из-за замены технологией.
Фрикционная безработица – это не обязательно плохо. На самом деле, поскольку фрикционная безработица является добровольной, она может быть признаком здоровой экономики. Это означает, что работники ищут новую работу и новую карьеру.
Ключевые моменты
- Фрикционная безработица – это результат смены рабочих мест в экономике.
- Фрикционная безработица естественно возникает даже в условиях растущей стабильной экономики.
- Рабочие, добровольно покидающие свои рабочие места, и новые рабочие, вступающие в рабочую силу, усугубляют фрикционную безработицу.
Понимание фрикционной безработицы
Уровень фрикционной безработицы рассчитывается путем деления трудящихся, активно ищущих работу, на общую численность рабочей силы. Работники, активно ищущие работу, обычно делятся на три категории: работники, которые уволились с работы, люди, возвращающиеся на рынок труда, и новые участники.
Недавним выпускникам школ и другим лицам, впервые ищущим работу, может не хватать ресурсов или эффективности для поиска компании, в которой есть доступная и подходящая работа. В результате они не берутся за другую работу, временно удерживаясь на более высокооплачиваемой работе. Временные переходы, такие как переезд в другой город или город, также усугубляют фрикционную безработицу, поскольку часто бывает промежуток времени между тем, когда рабочие увольняются с работы и находят новую.
Рабочие, увольняющиеся с работы в поисках лучшей оплаты, усугубляют фрикционную безработицу. В других случаях работники могут уволиться с работы, чтобы вернуться в школу или изучить новый навык, потому что они считают, что им необходимы навыки для получения большего дохода. Другие могут уйти с работы по личным причинам, например, из-за ухода за членом семьи, болезни, выхода на пенсию или беременности. Когда рабочие возвращаются к рабочей силе в поисках работы, они считаются частью фрикционной безработицы.
Феномен, когда люди бросают работу, не имея другой работы, свидетельствует о том, что они «верят» в то, что экономика достаточно крепка, чтобы не бояться безработицы. В последние годы он стал тщательно отслеживаемым индикатором потребительской уверенности, получившим название «Quit Rate».
Пособия по безработице, выплачиваемые государством, иногда могут приводить к фрикционной безработице, потому что доход позволяет работникам избирательно подходить к поиску следующей работы, дополнительно увеличивая время безработицы. Это также может происходить из-за того, что компании воздерживаются от приема на работу, поскольку считают, что для этой работы недостаточно квалифицированных специалистов.
Причины фрикционной безработицы
Новые участники на рынке труда
Недавним выпускникам, впервые ищущим работу, может не хватить ресурсов или эффективности, чтобы найти компанию, в которой есть свободная и подходящая для них работа. В результате они не устраиваются на другую работу и временно задерживаются в поисках более высокооплачиваемой работы. Временные переезды – например, переезд в другой город или поселок – также способствуют фрикционной безработице, поскольку часто возникает разрыв между увольнением с работы и поиском новой.
Поиск лучшей работы
Пандемия заставила многих людей задать себе эти вопросы: Что действительно важно в жизни? Доволен ли я своей ролью? Это то, чем я хочу заниматься? Что я должен делать со своей жизнью?
Явление, когда люди увольняются с работы, не имея другой, на которую можно было бы устроиться, свидетельствует о том, что они верят в то, что экономика достаточно устойчива, чтобы не бояться безработицы. В последние годы это явление, известное как “коэффициент увольнений”, стало тщательно отслеживаемым показателем потребительского доверия. Это явление также более вероятно, когда люди успели накопить сбережения и имеют ресурсы, чтобы справиться с месяцами безработицы.
Поиск большего заработка
Работники, которые увольняются с работы в поисках более высокой заработной платы, вносят свой вклад в фрикционную безработицу. В других случаях работники могут оставить работу, чтобы вернуться в школу или освоить новый навык, потому что они считают, что этот навык им необходим, чтобы зарабатывать больше. Другие могут покинуть рабочее место по личным причинам, таким как уход за членом семьи, болезнь, выход на пенсию или беременность. Когда работники возвращаются в ряды рабочей силы для поиска работы, они учитываются как часть фрикционной безработицы.
Поиск цели и смысла
Это очень важно. В основе всех причин фрикционной безработицы лежит фундаментальная тема. Поиск цели и смысла.
Мы – человеческие существа. Мы процветаем, когда живем с целью, ясностью и страстью. Мы чувствуем связь с нашей работой и нашими целями, когда мы понимаем цель. Но без цели легко почувствовать себя потерянным и сбиться с пути. Легко начать двигаться по жизни.
Но пандемия заставила нас обратить внимание на цель и смысл. Почти две трети сотрудников сообщили, что COVID-19 заставил их пересмотреть свое предназначение. Логично предположить, что основная причина фрикционной безработицы кроется в стремлении человека к цели.
Пособия по безработице
Пособия по безработице, выплачиваемые государством, иногда могут приводить к фрикционной безработице, поскольку такой доход позволяет работникам избирательно подходить к поиску следующей работы, тем самым продлевая период безработицы. Это также может происходить из-за того, что фирмы воздерживаются от найма на работу, поскольку считают, что квалифицированных специалистов недостаточно.
Краткая справка
Фрикционная безработица на самом деле выгодна, потому что это признак того, что рабочие добровольно ищут лучшие должности, предоставляя предприятиям более широкий круг квалифицированных потенциальных сотрудников.
Преимущества фрикционной безработицы
Фрикционная безработица всегда существует в экономике со свободно перемещающейся рабочей силой и на самом деле приносит пользу, потому что это показатель того, что люди по своему выбору ищут лучшие должности. Это также помогает предприятиям, поскольку дает им более широкий выбор потенциально высококвалифицированных кандидатов, претендующих на должности. Это краткосрочный период, и поэтому он не требует значительного расхода государственных ресурсов .
Фрикционная безработица сокращается за счет быстрого сопоставления потенциальных соискателей вакансий. Благодаря Интернету работники могут использовать социальные сети и веб-сайты с объявлениями о вакансиях для поиска работы, что может сократить сроки приема на работу.
Фрикционная безработица по сравнению с другими видами безработицы
Циклическая безработица
Фрикционная безработица не вызывает такого беспокойства, как циклическая безработица, которая преобладает в период рецессии и вызвана увольнением работников. В период рецессии, когда уровень безработицы растет, фрикционная безработица имеет тенденцию к снижению, поскольку работники обычно боятся покидать свои рабочие места в поисках лучшей работы.
Сезонная безработица
Сезонная безработица – это ситуация, когда работники остаются без работы в определенное время года в результате падения спроса. По мере смены сезонов и колебаний спроса некоторые рабочие места возвращаются. Сезонная безработица часто длится недолго, так как многие работники снова находят работу в разгар сезона.
Структурная безработица
Структурная безработица – это более серьезный вид безработицы. Она возникает, когда в экономике происходят фундаментальные структурные изменения, например, изменения в промышленности. Например, рассмотрим, как экологичные решения вытесняют менее экологичные варианты. По мере того как потребительский спрос смещается в сторону “зеленых” решений, рабочие места в менее востребованных отраслях начинают закрываться.
Какова основная причина фрикционной безработицы?
Фрикционная безработица в основном вызвана добровольным переходом на новые рабочие места в условиях высокоэффективной экономики. Фрикционная безработица часто вызвана тем, что люди добровольно уходят с работы в поисках работы с лучшей оплатой, возможностями или балансом между работой и личной жизнью.
Последствия фрикционной безработицы
Фрикционная безработица, как и любой другой вид безработицы, имеет свои последствия. Вот чего можно ожидать, когда в экономике преобладает фрикционная безработица.
- Работодатели могут испытывать трудности с удержанием талантов. Как мы уже видели на примере Великого увольнения, удержать таланты бывает непросто.
- Для организаций это означает, что инвестиции в опыт сотрудников важны как никогда. Компании повсюду стараются удовлетворить потребности своих сотрудников. В конечном счете, речь идет о том, чтобы ваши сотрудники были счастливы.
- На рынке талантов может возникнуть жесткая конкуренция. Как легче удержать талантливых сотрудников, так и труднее привлечь лучших. В настоящее время кандидаты регулярно получают множество предложений.
- В условиях современной экономики кандидаты нередко имеют возможность взвесить свои возможности. Для работодателей это означает, что вам лучше проявить себя с лучшей стороны. В условиях жесткой конкуренции на рынке талантов ваша организация должна быть на высоте, чтобы привлечь лучших специалистов.
- Экономика получает выгоду. Когда фрикционная безработица находится на самом высоком уровне, это означает, что дела в экономике идут хорошо. Здоровая экономика – это хорошо, от этого выигрывают и предприятия, и люди.
- У людей больше возможностей жить с толком. Если люди страдают от фрикционной безработицы, то, скорее всего, это связано с основополагающей причиной – целью.
Почему фрикционная безработица является проблемой?
Фрикционная безработица может быть сложной проблемой для работодателей, поскольку сотрудники чаще всего добровольно отказываются от работы. Компании должны помнить о необходимости инвестировать ресурсы в лучших исполнителей, иначе эти люди, скорее всего, будут искать другие возможности. С другой стороны, фрикционная безработица также может быть трудной для соискателей. Поскольку больше людей добровольно ищут работу, может возникнуть большая конкуренция, что затрудняет поиск новой работы.
Итог
Фрикционная безработица – это естественное экономическое явление, которое происходит, когда в экономике обычно все хорошо. Работники решают, что пришло время искать лучшие возможности, вернуться в школу, позаботиться о семье или просто улучшить свою жизнь вне работы. Фрикционная безработица все еще является проблемой для экономики, хотя она не такая постоянная, как структурная или циклическая безработица.
Вариант 1
1. Кто может претендовать на получение пособия по безработице?
1) строитель, утративший трудоспособность в результате производственной травмы
2) многодетная мать, которая не работает и не ищет работу
3) бухгалтер, который не работает, но ищет работу
4) электромонтер, работающий неполный рабочий день
Пояснение.
Только при вынужденной безработице человек получает по ней пособие от государства.
Строитель из варианта 1 получит не пособие по безработице, а пособие по нетрудоспособности.
Правильный ответ указан под номером 3.
Ответ: 3
2. Если численность занятых в стране равна 29 млн человек, численность рабочей силы — 30 млн человек, то уровень безработицы равен
1) 10%
2) 8%
3) 5,5%
4) 3,3%
Пояснение.
Расчет безработицы происходит по следующей формуле
Уровень безработицы = Количество безработных / рабочая сила * 100%
Количество безработных = численность рабочей силы — численность занятых = 30 — 29 = 1 млн
У. б = 1/30*100% = 3,3%
Правильный ответ указан под номером 4.
Ответ: 4
3. Если численность безработных в стране равна 5 млн человек, численность занятых — 45 млн человек, то уровень безработицы равен
1) 10%
2) 11%
3) 15%
4) 20%
Пояснение.
Рассчитывается по формуле: u= (U / L)*100%
u — уровень безработицы
U — число безработных
L — рабочая сила (занятые + безработные)
u= (5 / (45+5))*100% = 10%
Правильный ответ указан под номером 1.
Ответ: 1
4. Кто из перечисленных ниже граждан является структурным безработным?
1) уволившийся учитель, рассчитывающий найти более легкую работу
2) женщина, находящаяся в отпуске по уходу за ребенком
3) шахтер, уволенный в связи с закрытием нерентабельной шахты
4) медсестра, переехавшая с мужем в другой город
Пояснение.
Структурны безработный не может работать из-за невостребованной квалификации.
Правильный ответ указан под номером 3.
Ответ: 3
5. Повторяющиеся спады производства порождают безработицу
1) сезонную
2) структурную
3) циклическую
4) фрикционную
Пояснение.
Цикл — повторяющаяся единица.
Сезонная — тоже повторяется, но она постоянна, т. к. зависит от времён года. например — работа в парке.
Структурная — всвязи с устарением каких — либо организация или технологий.
Фрикционная — когда человек ищет работу.
Правильный ответ указан под номером 3.
Ответ: 3
6. К неэкономическим отрицательным последствиям безработицы относится
1) рост числа правонарушений
2) повышение конкуренции на рынке труда
3) недополученный выпуск продукции
4) уменьшение шансов найти высокооплачиваемую работу в будущем
Пояснение.
Варианты 2, 3, 4 не подходят, т. к. они относятся к экономическим отрицательным последствиям безработицы, а вариант 1 — к неэкономическим.
Правильный ответ указан под номером 1.
Ответ: 1
7. Кто из перечисленных ниже граждан является циклическим безработным?
1) банковский служащий, уволенный в связи с банкротством банка во время финансово-экономического кризиса
2) инженер, уволившийся в связи с переездом в другой город
3) программист, уволенный из-за конфликта с руководством фирмы
4) студент дневного отделения вуза
Пояснение.
Безработица — социально-экономическое явления, при котором часть рабочей силы не занята в производстве товаров и услуг.
Фрикционная безработица — связана с затратами времени на поиск новой работы и длится 1-3 месяца.
Структурная безработица — связана с технологическими изменениями в производстве, которые изменяют стурктуру спроса на рабочую силу (возникает если работник уволенный из одной отрасли не может устроиться в другой).
Циклическая безработица — возникает в период циклического экономического спада и недостатка спроса. Возникает с связи с уменьшением реального ВНП и высвобождением части рабочей силы.
Институциональная безработица — возникает из-за ограниченности рабочей силы и работодателей в актуальной информации о вакансиях и желании работников.
Правильный ответ указан под номером 1.
Ответ: 1
8. При определении качества такого фактора производства, как «труд» обязательно обращают внимание на
1) наличие у работника определенных умений и навыков
2) готовность работника участвовать в жизни коллектива
3) эффективность используемого оборудования
4) наличие на предприятии системы охраны труда
Пояснение.
Правильный ответ указан под номером 1.
Ответ: 1
9. К рынку экономических ресурсов относится
1) рынок труда
2) товарный рынок
3) фондовый рынок
4) валютный рынок
Пояснение.
ЭКОНОМИЧЕСКИЕ РЕСУРСЫ — совокупность материальных и нематериальных факторов и средств, обеспечивающих функционирование общественного производства, бесперебойный процесс общественного производства и воспроизводства.
Выделяют следующие их виды: природные (сырьевые, географические); трудовые (человеческий капитал); капитальные (физический капитал); оборотные средства; финансовый капитал; предпринимательские способности; интеллектуальный потенциал и др.
Правильный ответ указан под номером 1.
Ответ: 1
10. В стране А. уголь перестал использоваться в энергетической отрасли. Закрылось большинство шахт, шахтёры потеряли работу. Какого типа безработица наблюдается в стране А.?
1) циклическая
2) структурная
3) фрикционная
4) сезонная
Пояснение.
Структурная безработица обусловлена изменениями в структуре спроса на труд, когда образуется структурное несовпадение между квалификацией безработных и требованием свободных рабочих мест.
Циклическая обусловлена определенной фазой экономического цикла — кризисом, спадом.
Фрикционная — время добровольного поиска работником нового места работы, которое устраивает его в большей степени, нежели прежнее рабочее место.
Сезонная возникает в связи с изменением спроса на рабочую силу в зависимости от времени года, объясняется особенностями функционирования сельского хозяйства, лесного хозяйства, рыболовства.
Правильный ответ указан под номером 2.
Ответ: 2
11. Рост занятости женщин, имеющих малолетних детей, в процессе производства сопровождается увеличением спроса на услуги профессиональных нянь. Это пример функционирования рынка
1) труда
2) товаров
3) капиталов
4) фондового
Пояснение.
Няня — это рабочая сила.
Рабочая сила — это товар на рынке труда.
Правильный ответ указан под номером 1.
Ответ: 1
12. Спрос на услуги специалистов по рекламе формируется на рынке
1) информации
2) товаров и услуг
3) капитала
4) труда
Пояснение.
Рынок труда — сфера формирования спроса и предложения на рабочую силу. Через него осуществляется продажа рабочей силы на определенный срок. Особенность рынка труда и его механизма: объектом купли-продажи на нем является право на использование рабочей силы, знаний, квалификации и способностей к трудовому процессу.
Рынок капиталов (рынок капитала) — часть финансового рынка, на котором обращаются длинные деньги, то есть денежные средства со сроком обращения более года. На рынке капиталов происходит перераспределение свободных капиталов и их инвестирование в различные доходные финансовые активы.
Рынок товаров и услуг — это организованная структура, посредством которой спрос на товары со стороны домашних хозяйств и правительства встречается с предложением со стороны бизнеса.
Рынок информации — сфера формирования спроса и предложения на информацию.
Правильный ответ указан под номером 4.
Ответ: 4
13. В связи с финансовым кризисом в области Н. руководство региона приняло решение о снятии доплат учителям и сокращении стимулирующей части фонда заработной платы. Какое изменение произойдет на рынке труда в сфере образования данной области?
1) уровень конкуренции на рынке труда возрастет
2) в массовом порядке начнется приток педагогов из соседних, более богатых, регионов
3) предложение рабочей силы возрастет
4) из отрасли начнется отток рабочей силы
Пояснение.
Правильный ответ указан под номером 4.
Ответ: 4
14. Ферма после уборки урожая сократила количество работников. Механизаторы и комбайнеры вновь будут набираться на ферму только весной следующего года. Приведенный пример иллюстрирует безработицу
1) фрикционную
2) сезонную
3) циклическую
4) структурную
Вариант 2
Пояснение.
Дадим определение каждому из вариантов.
Фрикционная безработица — время добровольного поиска работником нового места работы, которое устраивает его в большей степени, нежели прежнее рабочее место.
Сезонная безработица — зависит от колебаний в уровне экономической активности в течение года, характерных для некоторых отраслей экономики.
Циклическая безработица — вызывается повторяющимися спадами производства в стране или регионе. Представляет собой разницу между уровнем безработицы в текущий момент экономического цикла и естественным уровнем безработицы. Для разных стран естественным признаётся разный уровень безработицы.
Структурная безработица — обусловлена изменениями в структуре спроса на труд, когда образуется структурное несовпадение между квалификацией безработных и требованием свободных рабочих мест.
Правильный ответ указан под номером: 2.
Ответ: 2
1. Гражданка Р., квалифицированный бухгалтер после продолжительного перерыва в работе не может найти работу по специальности. От предложенных ей вакансий секретаря и консьержки она отказалась и ожидает предложений по специальности. Приведенный пример иллюстрирует безработицу
1) фрикционную
2) сезонную
3) циклическую
4) структурную
Пояснение.
Приведем значения терминов.
Фрикционная безработица — время добровольного поиска работником нового места работы, которое устраивает его в большей степени, нежели прежнее рабочее место.
Сезонная безработица — зависит от колебаний в уровне экономической активности в течение года, характерных для некоторых отраслей экономики.
Циклическая безработица — вызывается повторяющимися спадами производства в стране или регионе. Представляет собой разницу между уровнем безработицы в текущий момент экономического цикла и естественным уровнем безработицы. Для разных стран естественным признаётся разный уровень безработицы.
Структурная безработица — обусловлена изменениями в структуре спроса на труд, когда образуется структурное несовпадение между квалификацией безработных и требованием свободных рабочих мест.
Правильный ответ указан под номером: 1.
Ответ: 1
2. В банковском секторе экономики наступил период роста, возрос спрос на банковские услуги. Какое изменение произойдёт на рынке труда в данной отрасли?
1) начнётся активный набор персонала и открытие новых филиалов
2) снизится активность молодых кадров
3) возрастёт количество сотрудников, переходящих в другие сектора экономики
4) будет отменён социальный пакет для работников
Пояснение.
В данном случае речь идет об этапе роста. Для него характерен активный рост, набор персонала, чему соответствует вариант 1.
Правильный ответ указан под номером: 1.
Ответ: 1
3. Какой из приведённых примеров деятельности фирмы «Крендели и халы» характеризует такой фактор производства, как труд?
1) эксклюзивные рецепты выпечки традиционных хлебобулочных изделий к праздникам
2) договора с сетью кафе домашней кухни на поставку горячей выпечки
3) персонал хлебопёков и кондитеров, имеющий международные сертификаты
4) арендуемые фирмой помещения, в которых располагаются пекарни
Пояснение.
Труд — умственные и физические способности людей, их опыт и навыки, используемые для производства экономических благ.
Правильный ответ указан под номером: 3.
Ответ: 3
4. К негативным последствиям безработицы относится
1) стремление работников к повышению своей квалификации
2) создание и деятельность государственных служб занятости
3) утрата частью трудоспособного населения трудовых навыков и стимулов к труду
4) расширение возможностей для женщин заниматься домашним хозяйством и воспитанием детей
Пояснение.
Понятно, что к негативным последствиям безработицы относятся утрата частью трудоспособного населения трудовых навыков и стимулов к труду.
Правильный ответ указан под номером: 3.
Ответ: 3
5. Повышение востребованности специалистов в области юридических наук иллюстрирует ситуацию на рынке
1) труда
2) инноваций
3) средств производства
4) капиталов
Пояснение.
Труд — это физические и умственные способности человека, используемые для производства экономических благ. Так как речь идет о людях, их специализации, следовательно это пример иллюстрирующий рынок труда.
Правильный ответ указан под номером: 1.
Ответ: 1
6. Рост популярности кафе с разнообразным ассортиментом чая, кофе и сладостей резко повысил потребность в таких специалистах, как кондитеры, бармены и официанты. Какое свойство рынка труда проявилось в данном факте?
1) связь спроса на труд со спросом на услуги
2) установление определённого уровня безработицы
3) государственное регулирование занятости
4) высокая конкуренция работников
Пояснение.
В данном случае указана связь спроса на труд (повышение потребности на кондитеров, барменов, официантов) со спросом на услуги (рост популярности кафе).
Правильный ответ указан под номером: 1.
Ответ: 1
7. Повышение уровня безработицы в традиционных отраслях и наличие свободных мест в сфере высоких технологий и услуг характеризуют ситуацию на рынке
1) товаров и услуг
2) труда
3) средств производства
4) информации
Пояснение.
В данном случае проиллюстрировано изменение на рынке труда.
Правильный ответ указан под номером: 2.
Ответ: 2
8. Экономический кризис привёл к закрытию предприятий и росту безработицы во многих отраслях. Какой вид безработицы иллюстрируется этим примером?
1) структурная
2) фрикционная
3) циклическая
4) сезонная
Пояснение.
Основные виды безработицы.
Структурная − невозможность трудоустройства из-за различий в структуре спроса и предложения рабочей силы разной квалификации.
Фрикционная − работнику, уволенному или покинувшему предприятие по своей воле требуется время для нахождения нового рабочего места.
Циклическая − характерна для экономического кризиса, возникает в результате спада производства.
Сезонная − возникает в результате изменения спроса на рабочую силу в зависимости от времени года.
Правильный ответ указан под номером: 3.
Ответ: 3
9. Человек, который болен бронхитом, оформил больничный лист и в период его действия временно не работает, относится к категории
1) безработных
2) временно безработных
3) не включаемых в общую численность рабочей силы
4) занятых
Пояснение.
Рабочая сила − общее число лиц, занятых и безработных в возрасте от 16 до принятого возраста выхода на пенсию, исключая недееспособных.
К категории безработных относятся люди, потерявшие работу, состоящие на учете в центрах занятости, но активно ее ищущие и готовые к ней приступить немедленно.
К категории занятых относятся люди, имеющие работу, в том числе занятые неполный рабочий день или неполную рабочую неделю. В эту группу входят работающие по найму, те кто занят частным бизнесом, люди, находящиеся на государственной службе.
К категории выбывших из состава рабочей силы относятся студенты, домохозяйки, пенсионеры не по возрасту.
Человек, оформивший больничный лист относится к категории занятых.
Правильный ответ указан под номером: 4.
Ответ: 4
10. К экономически активному трудоспособному населению относятся
1) старшеклассники общеобразовательных школ
2) выпускники университетов
3) владеющие собственностью пенсионеры
4) студенты дневных отделений вузов
Пояснение.
Экономически активное население (рабочая сила) − общее число лиц, занятых и безработных в возрасте от 16 до принятого возраста выхода на пенсию, исключая недееспособных.
К категории выбывших из состава рабочей силы относятся студенты, домохозяйки, пенсионеры не по возрасту.
Таким образом к экономически активному трудоспособному населению относятся выпускники университетов.
Правильный ответ указан под номером: 2.
Ответ: 2
11. Экономический кризис привёл к закрытию предприятий и росту безработицы во многих отраслях. Какой вид безработицы иллюстрируется этим примером?
1) фрикционная
2) сезонная
3) структурная
4) циклическая
1Пояснение.
Основные виды безработицы.
Структурная − невозможность трудоустройства из-за различий в структуре спроса и предложения рабочей силы разной квалификации.
Фрикционная − работнику, уволенному или покинувшему предприятие по своей воле требуется время для нахождения нового рабочего места.
Циклическая − характерна для экономического кризиса, возникает в результате спада производства.
Сезонная − возникает в результате изменения спроса на рабочую силу в зависимости от времени года.
Правильный ответ указан под номером: 4.
Ответ: 4
2. После замужества дочери Анна уволилась из бухгалтерии, намереваясь, устроиться на работу с более гибким графиком, чтобы нянчить внуков. Какой вид безработицы иллюстрирует данная ситуация?
1) сезонную
2) циклическую
3) фрикционную
4) структурную
Пояснение.
Безработица — наличие лиц, трудоспособного возраста, не имеющих работы, пригодных к ней и ищущих её.
Виды безработицы:
1. Фрикционная — самостоятельное перемещение работника с одного места на другое.
2. Структурная — связана с переквалификацией работников и структурными изменениями в экономике. Фрикционная + структурная = естественная безработица или полная занятость.
3. Циклическая — в условиях кризиса
4. Сезонная
5. Скрытая — переход на сокращённый режим работы.
Правильный ответ указан под номером: 3.
Ответ: 3
13. Рост популярности ресторанов с разнообразным ассортиментом резко повысил потребность в таких специалистах, как повара. Какую особенность рынка труда иллюстрирует этот пример?
1) установление определённого уровня безработицы
2) высокую конкуренцию работников
3) мобильность работников
4) связь спроса на труд со спросом на товары и услуги
Пояснение.
В данном случае данный пример иллюстрирует такую особенность как связь спроса на труд со спросом на товары и услуги.
Правильный ответ указан под номером: 4.
Ответ: 4
14. Гражданка K. уволилась со своего предприятия и ищет новое место работы.
О каком виде безработицы идёт речь?
1) циклическая
2) структурная
3) скрытая
4) фрикционная
![]()
Пропустить и перейти к созданию новой учетной записи
Центр развития электронных образовательных ресурсов
В Вашем браузере должен быть разрешен прием cookies
Некоторые курсы, возможно, открыты для гостей
Вы в первый раз на нашем сайте?
- Заполните новую учетную запись (форму, содержащую данные о вас).
- На указанный e-mail будет отправлено письмо.
- Прочитайте письмо и проследуйте по ссылке, которую оно содержит.
- Учетная запись будет подтверждена и система вас идентифицирует.
- Итак, у вас появился доступ к сайту.
Уже есть аккаунт?
Логин или email
Пароль
Запомнить логин
Забыли логин или пароль?
Войти через Google
Войти через OpenEdu
Войти через СЦОС
Войти через LkMSU